Guide
Flying in September: why the best month of the year works
September 2025 ran 83.4% on time, the strongest month in the data against 77.3% for the year. 53 of 60 airports cleared 80%. Here is why it works.

September 2025 ran 83.4% on time. Across the whole of September 2025 to August 2026 the national figure was 77.3%, and no other month came as close to the top: September was the best month of the twelve, and the best month at more airports than any other. Of the 60 airports with a page, 53 cleared 80% on time. In July 2026 the same count was 4.
It is one September, and a single hurricane can erase it.
But the reasons it worked are structural, and they repeat most years.
The shape of the year
Each month is one calendar month: August to December 2025, January to July 2026. Source: US DOT Bureau of Transportation Statistics, September 2025 to August 2026.
The national strip has two troughs, summer and midwinter, and September sits at the top of the stretch between them. It beat October 2025 (79.7%) and November 2025 (79.4%), the other autumn months, by a clear margin, and it beat August 2025, the month immediately before it, 83.4% to 73.1%.
Three things switch off at once
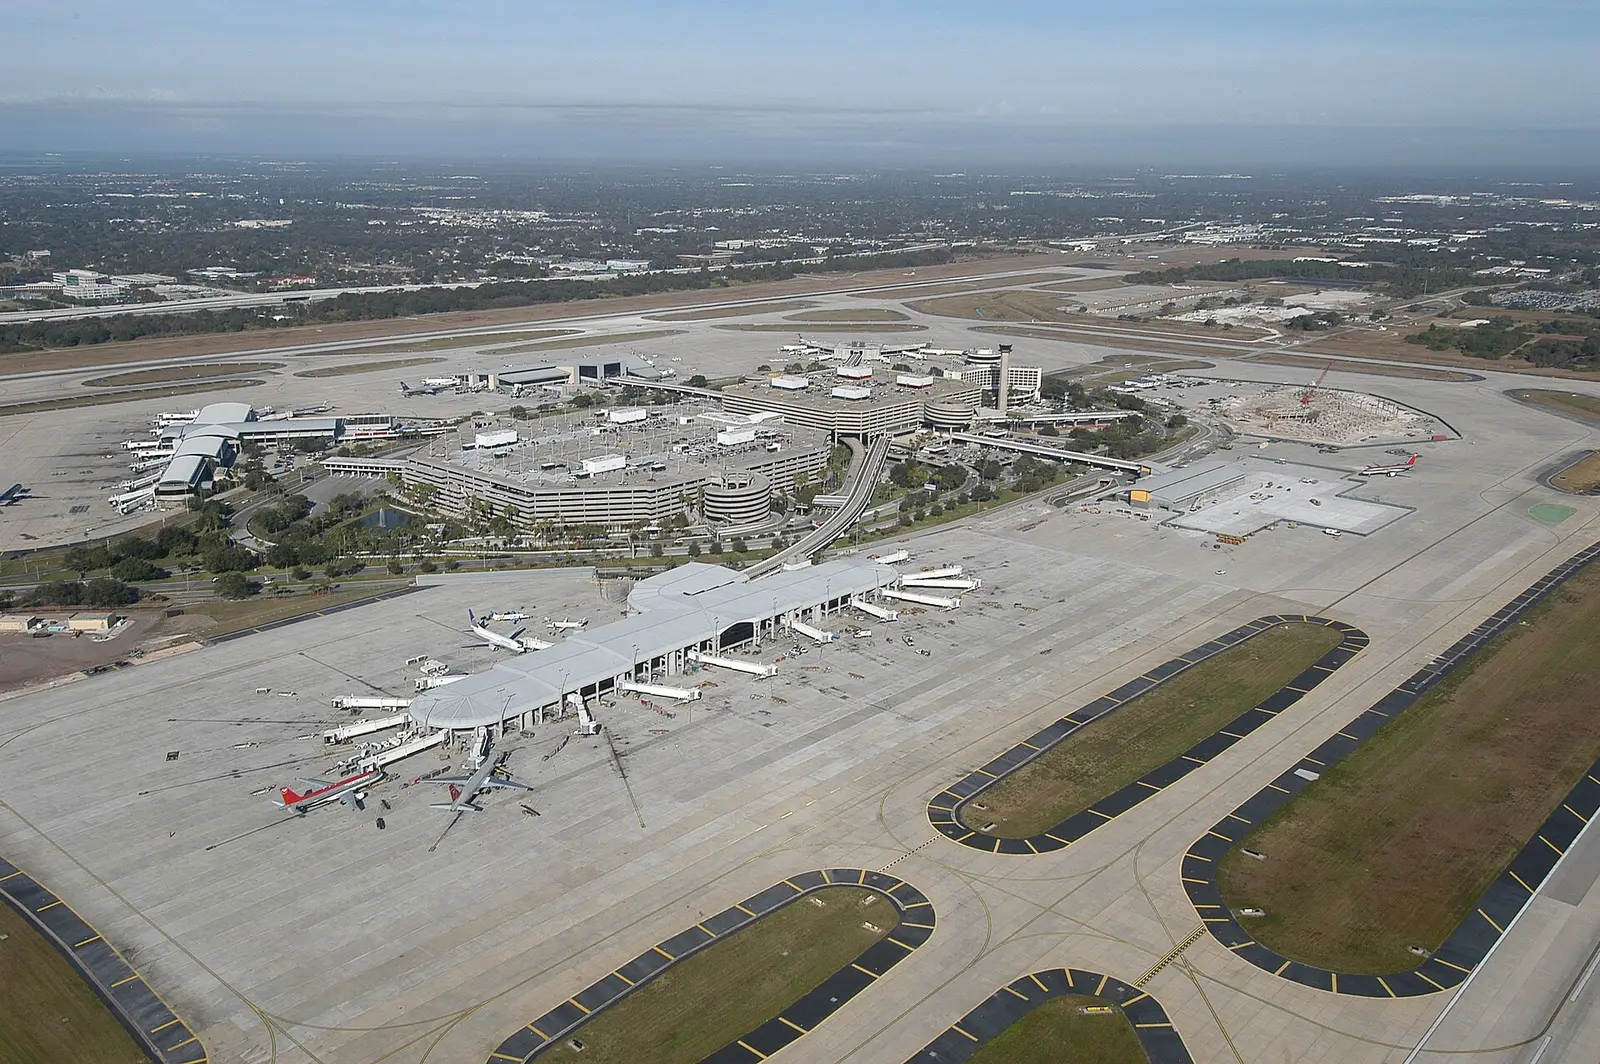
Demand falls away after Labor Day. Schools go back, family travel stops, and airlines trim their schedules to match. September 2025 carried fewer flights than any month except January and February, and fewer per day than August. Full aircraft and packed banks are what turn one late flight into five; take out the marginal flights and the ones left have room to recover. Florida shows it most clearly. September is the start of the off season there, the schedule drops sharply, and Orlando, Tampa and Fort Lauderdale all had their best month of the year.
Afternoon convection fades. The daily thunderstorm cycle over the Southeast and Texas weakens through September. The airports that suffered most in the summer, the storm-belt hubs, recovered the most.
Winter has not started. No de-icing, no snow, no ground stops for visibility at northern hubs. The winter storm guide covers what arrives in December; September is the last month with none of it.
There is a fourth factor that belongs in the uncertainty column. September is the peak of the Atlantic hurricane season, and in September 2025 no hurricane reached the US mainland. A landfall in Florida or on the Gulf coast stops airports outright for two or three days and wrecks the month's cancellation rate. The figures here describe a September without one.
Who improved most
AugustSeptember
55.0%90.0%
On-time rate for departures in August 2025 and September 2025. Both months are from the same summer. Source: US DOT Bureau of Transportation Statistics, September 2025 to August 2026.
Every airport in the data bar two improved from August to September 2025, and the biggest gains belonged to the airports the summer hurt most. Orlando in September ran 84.6% on time after 68.3% in August. Tampa went from 72.3% to 87.1%, and Dallas-Fort Worth from 73.5% to 77.4%. Houston Intercontinental and Charlotte each gained more than ten points.
Those are August-to-September comparisons inside the same year, so for once the month-to-month change is a clean read. Both Fort Lauderdale in September, at 82.8%, and Miami, at 78.6%, posted their best month, which at Fort Lauderdale means a figure some way above its annual average of 70.4%.
The ranking
US average 83.4%
65.0%95.0%
Flights departing each airport in September 2025, scored on arrival. The dashed line is the national September figure. Source: US DOT Bureau of Transportation Statistics, September 2025 to August 2026.
Honolulu (HNL) led at 91.4%, which is expected. The rest of the top ten is not the usual list. Fort Myers in September ran 88.2%, Memphis 87.5%, Detroit 87.1%, and Atlanta 86.5%. Atlanta's September sits more than eight points above its year, which for the busiest airport in the country is a very large number: it is what a hub bank looks like when every inbound aircraft arrives on schedule.
The weak end is short. Boston (BOS) came last at 75.7%, one of only two airports that ran worse than in August. Boston in September ran almost exactly its annual average (74.6%), with late-arriving aircraft carrying an unusually large share of the delay. Boston's best month was August, not September, which makes it the clearest exception to the national pattern.
Airlines
US average 83.4%
70.0%95.0%
Source: US DOT Bureau of Transportation Statistics, September 2025 to August 2026.
Most carriers had their best month in September. Hawaiian Airlines led at 88.4%, with Delta at 87.6%; Delta's best month of the year was September. Spirit ran 84.2%, its best month and more than eleven points above its annual 72.0%. That is the budget-carrier story in a single figure: with spare seats and a lighter schedule, a thin operation holds up, and the gap to the network airlines narrows. Read Spirit's annual figure with care, though (its filings stop in early May 2026, so the data has no Spirit flights in June or July, two of the weakest months nationally). American finished last at 79.1%, still some way above its own annual 74.7%.
The hub level shows the same recovery. Delta at Atlanta and American at Charlotte both ran September far above their summer figures, and American at Dallas-Fort Worth, the weakest big operation of the summer, recovered by more than fifteen points on August.
What September does not fix
The hour still matters. Adding up the September pages of all 60 airports, the 5pm–8pm departures ran close to twenty points behind the 5am–8am ones, not far off the 21.3-point gap for the whole year. A good month lifts every window; it does not flatten the day. Aircraft still fly five or six legs, and the evening departure still inherits whatever the morning lost. The best time of day guide explains the mechanism.
The airports that are structurally tight stay tight. Washington National in September ran 77.9%, better than its year but still in the bottom handful. Slot limits and a short main runway do not change with the season. Even in the best month of the year, I would not put a tight evening connection behind a National departure.
Labor Day
The month opens with the tail of the holiday weekend. The Labor Day weekend in 2025 ran 81.0% on time against 81.5% in the surrounding weeks, 0.5 points worse, which is close to no effect at all. The Labor Day guide covers the weekend in detail. What matters for September is what happens after it: once the holiday return is done, the schedule thins and the good weeks begin.
How I would use September
Move the flexible trip here. If the dates can move, the two weeks after Labor Day are the most reliable stretch of the year for most US airports. If I could move only one trip a year, it would go into those two weeks.
Florida and Gulf trips carry a hurricane caveat. The on-time figure for September is excellent and the tail risk is a named storm. Book refundable where you can, watch the forecast from a week out, and do not stack a cruise or a wedding on a same-day arrival.
Connections become easier, not risk-free. In September a hub like Atlanta or Houston behaves like a well-run airport rather than a storm-bound one. A buffer that fails in July often holds in September; the connection buffer guide sets out what the data says a buffer should be.
Boston is the exception. If your trip starts in Boston, September does not buy the improvement it buys elsewhere. Book the first wave there regardless.
Check the September pages: Orlando in September · Atlanta in September · Dallas-Fort Worth in September · Boston in September · Best time to fly tool