Guide
Flying in March: the month winter and spring overlap
US flights ran 75.7% on time in March 2026, below the 77.3% annual rate. Chicago, LaGuardia and Southwest's Texas airports carried the damage, not only Florida.

In March 2026 US domestic flights ran 75.7% on time, below the 77.3% recorded across September 2025 to August 2026. Only three months were worse. February, just before it, had been the second-best month of the year.
March is a hinge. The northern half of the country is still in winter, with late snowstorms that arrive after airports have started to relax. The southern half is warming into its first thunderstorms. And the schedule fills up again after the winter lull, because spring break puts students, families and a large share of leisure travellers in the air in the same few weeks. Each of those on its own would cost a point or two.
In March they overlap.
The Florida side of the month has its own guide: spring break flying compares the leisure airports in March and April. This one looks at the rest of the country, where the bigger problems were.
The best and worst airports in March
US average 75.7%
50.0%90.0%
Source: US DOT Bureau of Transportation Statistics, September 2025 to August 2026.
The top of the table is almost entirely western. Portland (PDX) led at 86.3% and Salt Lake City (SLC) ran 85.8%. Portland in March and Salt Lake City in March both sit on the dry side of spring: rain and wind, rarely a runway closed.
San Francisco had its best month of the year in March. SFO in March ran 84.0% on time against 75.3% for the year, and flights into it did even better: Los Angeles to San Francisco, one of the least punctual busy routes in the country across the year at 60.1%, ran 85.2% in March. The Bay Area guide explains why SFO's arrival rate depends so heavily on visibility; March sits before both the summer marine-layer season and the summer crowds.
The bottom of the table is where the story is. Fort Lauderdale was last at 59.7%, which the spring break guide covers. Directly above it came two Chicago airports, LaGuardia, and Houston Hobby.
Chicago: winter's last word
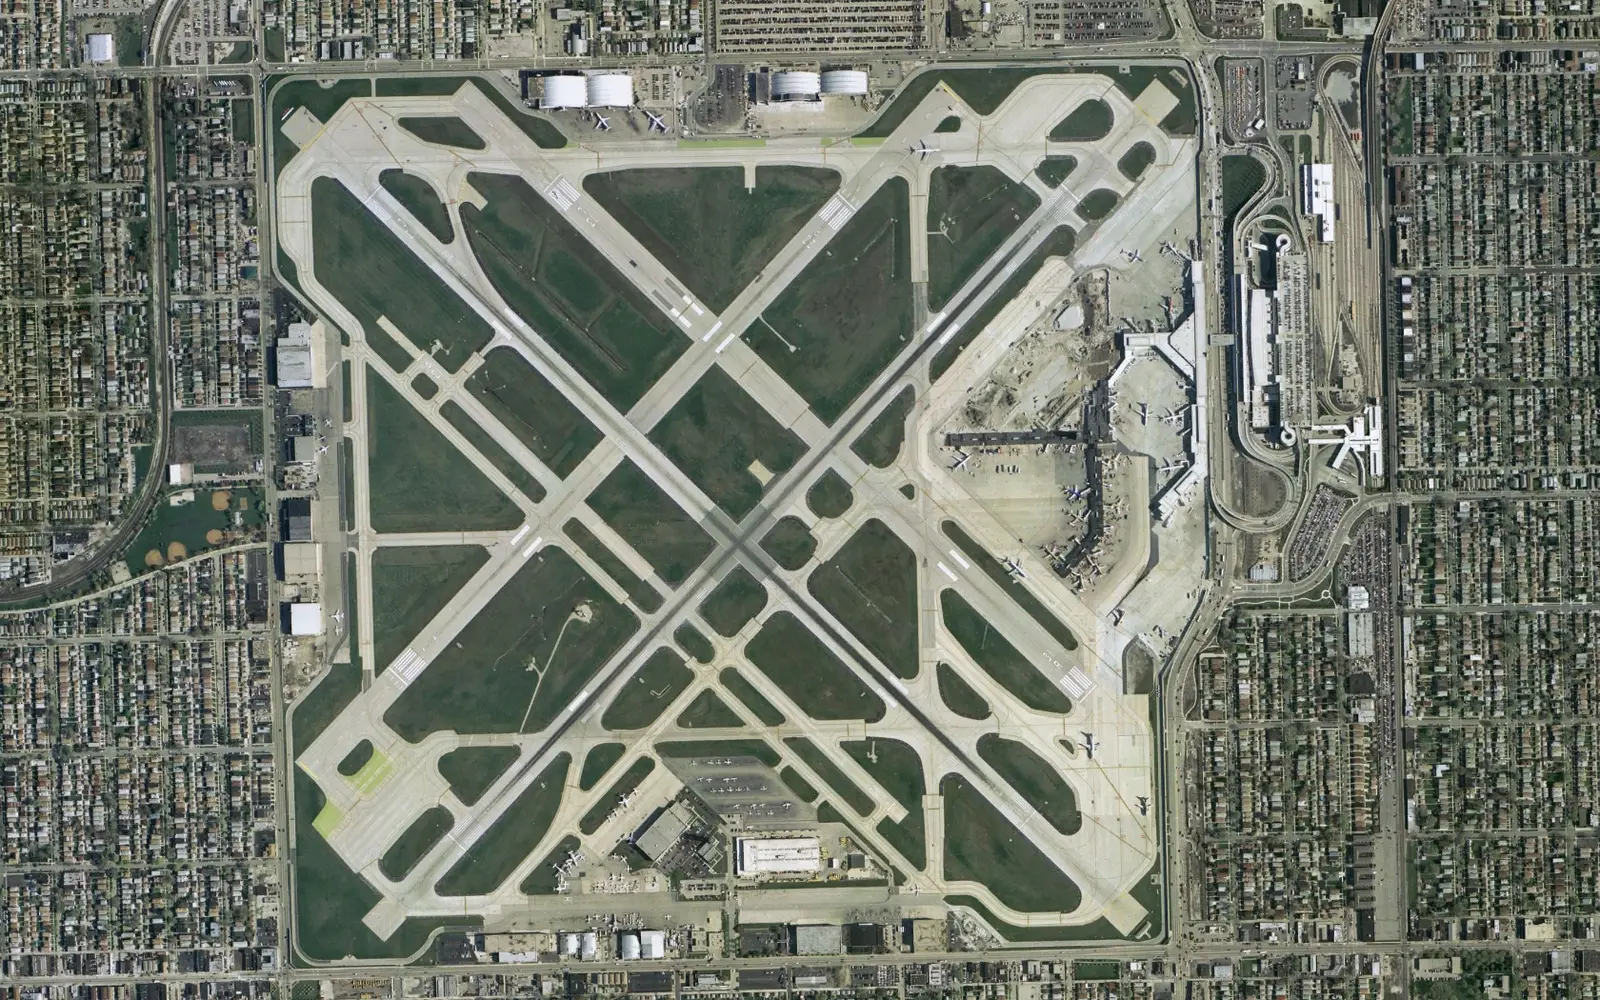
O'Hare ran 65.9% on time in March, and Chicago Midway in March 68.7%, well under its 74.2% annual figure. Cancellations tell you what kind of month it was: O'Hare in March cancelled far more of its schedule than its annual 2.80%, and so did Milwaukee and Minneapolis. A cancellation pattern concentrated across the upper Midwest is the signature of late-season snow rather than of anything the airlines did.
The regional partners took the worst of it at O'Hare. SkyWest at O'Hare, which flies United Express and American Eagle routes to smaller Midwestern cities, cancelled close to one flight in eleven in March 2026, while United at O'Hare kept its cancellations far lower. That is how airlines usually protect a hub in a storm: the 50-seat flights to Grand Rapids and Madison go first, so the mainline banks can keep running. If you are flying a regional route out of Chicago in March, your odds are worse than the airport figure suggests, and I would not trust the airport average to describe them.
The Chicago guide compares the two airports across the year. In March 2026 neither was a safe choice.
Denver, often assumed to be the risky hub in spring, was not. Denver in March ran 76.8%, almost exactly its annual 76.6%. Colorado's March snowstorms can be heavy, but the airport clears them routinely, and in this March the data shows no Denver-specific problem. One year is one sample, so this is not a promise about next March.
LaGuardia and the Northeast shuttles
LaGuardia ran 67.9% on time in March and cancelled about one departure in ten, the highest rate of any major airport that month and roughly double its own annual 5.04%. Republic Airways, which flies regional routes for Delta, United and American from the airport, carried the most cancellations; Republic at LaGuardia has the detail.
The routes showed it. O'Hare to LaGuardia ran 54.6% on time in March, Washington National to LaGuardia 53.1%, and Fort Lauderdale to LaGuardia just 45.8%, the last of those combining Florida's spring peak with LaGuardia's constraints. LaGuardia runs close to its capacity on a good day, with little room to absorb a lost hour, and the New York airports guide explains why its figures swing so far.
FebruaryMarch
55.0%90.0%
Figures are on-time percentages. Source: US DOT Bureau of Transportation Statistics, September 2025 to August 2026.
The chart makes the hinge visible. Most of these airports lost ground between February and March, and the airports that lost most were in Chicago, New York and Texas. Salt Lake City and Portland barely moved, and San Francisco improved.
Texas and Southwest
Houston Hobby ran 67.5% on time in March, its worst month outside summer and far below its annual 76.5%. Hobby in March was almost entirely a Southwest operation, and so were Dallas Love Field in March at 70.3% and Midway. Austin, where Southwest is also the largest carrier, ran 73.3%.
Southwest ran 74.4% on time across its network in March, against 84.8% in January. Its model makes it unusually sensitive to a bad spring: aircraft fly several short point-to-point legs a day with tight turns, so a delay in Chicago in the morning is still on the aircraft in Houston in the evening. Late-arriving aircraft accounted for close to half of Hobby's March delay minutes. The Southwest at Houston Hobby page shows the month-by-month pattern.
The worst airline of the month was not Southwest, though.
US average 75.7%
45.0%85.0%
Source: US DOT Bureau of Transportation Statistics, September 2025 to August 2026.
Spirit Airlines ran just 54.2%, its weakest month in the data (a shorter record than the others: Spirit's filings stop in early May 2026, and the data has no Spirit flights in June or July), and at the top Envoy Air led at 80.1%.
Spring break week
This site measures spring break as 10 to 25 March, the peak fortnight of college and school breaks, against the weeks either side.
During the holidayNormal weeks either side
65.0%85.0%
All US flights. Normal weeks are the two weeks either side of the window, excluding other holidays. Source: US DOT Bureau of Transportation Statistics, September 2025 to August 2026.
In 2026 the window ran 73.1% on time, 5.8 points worse than its normal weeks, with 4.06% of flights cancelled against 1.67%. It was the first of the four years on record to count as a measurable holiday effect; the three before it all sat within two points of normal. The 2026 spring break page has the day-by-day record, and the overview compares the years. I read one bad year after three ordinary ones as weather that happened to land in the window, not a permanent spring break penalty.
How I would book March
Treat Chicago and New York as winter airports until April. If a March itinerary can connect in Denver, Salt Lake City or Phoenix instead of O'Hare or LaGuardia, this data says take it. With LaGuardia at 67.9% in March 2026, I would not put a same-day connection behind a LaGuardia departure that month.
Avoid the regional leg out of a storm-hit hub. When a Midwest storm is forecast, the small-city flights from O'Hare and LaGuardia are the first cancelled. A mainline flight to a bigger airport and a drive can be the safer plan.
On Southwest, fly the first wave. Its aircraft carry the day's delays forward, so a 7am departure from Hobby or Love Field starts clean. The best time to fly tool shows the hour pattern for any route.
If the dates can move, move towards April. Nationally April 2026 ran 79.8% against March's 75.7%, and the April guide covers why.
March by airport: Chicago O'Hare (ORD) · Chicago Midway (MDW) · LaGuardia (LGA) · Houston Hobby (HOU) · Dallas Love Field (DAL) · San Francisco (SFO) · Portland (PDX) · Compare any US route