Guide
Flying in April: the Northeast's window, and San Francisco's turn
April 2026 ran 79.8% on time with almost no cancellations. Washington Dulles had its best month and Newark nearly did; flights into San Francisco fell apart.

US domestic flights ran 79.8% on time in April 2026, well up on March's 75.7% and comfortably above the 77.3% annual rate. Cancellations nearly vanished: fewer than one flight in a hundred was cancelled nationally, less than a third of March's rate. By both measures April was one of the four best months in this data, alongside September 2025, October 2025 and February 2026.
The mechanism is subtraction. The northern snowstorms have stopped. The daily afternoon thunderstorms that define summer in the South and the Midwest have not properly started. Spring break has mostly passed, and the summer peak is two months away. An April schedule meets the fewest obstacles of any month outside the early autumn.
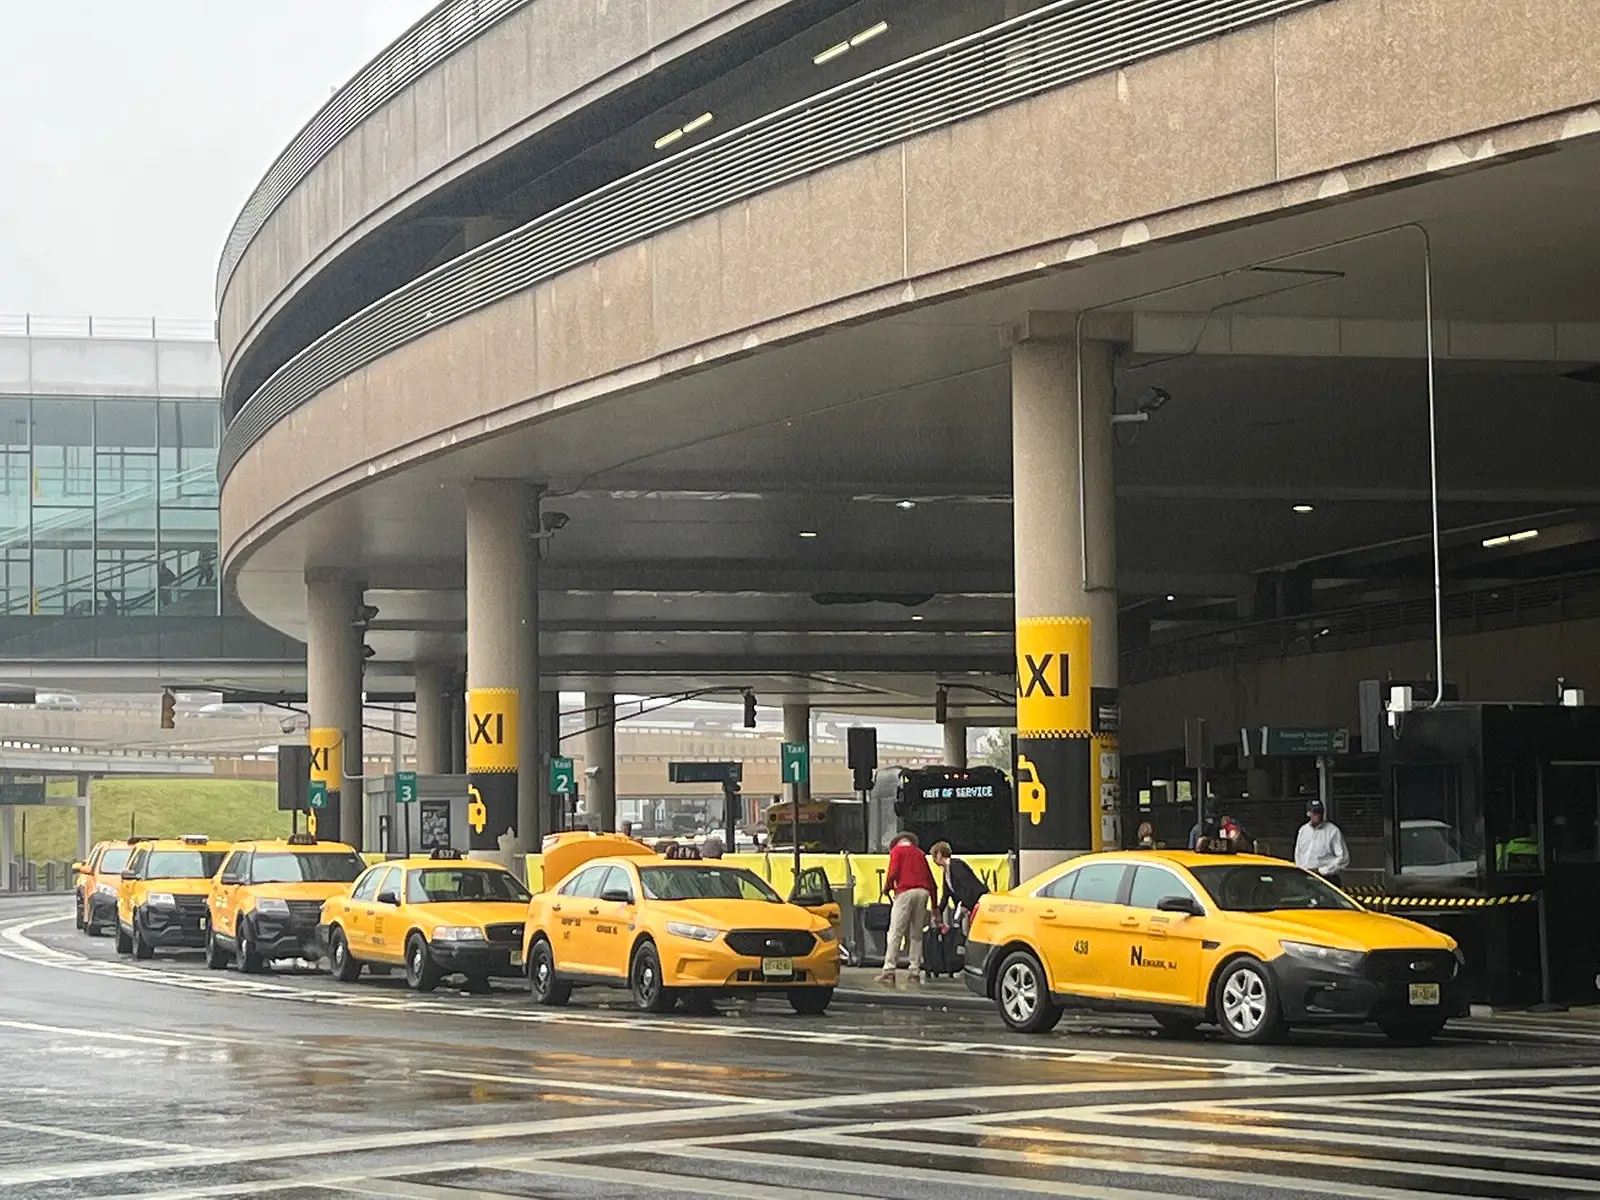
That lifts airports that usually sit in the bottom half of the table, Newark among them, into the top ten.
The Northeast's month
US average 79.8%
60.0%90.0%
Source: US DOT Bureau of Transportation Statistics, September 2025 to August 2026.
Washington Dulles in April ran 87.2% on time, its best month of the year, and Washington (IAD) topped the national table at 87.2%. That is the headline, but the pattern around it is the real point: Newark in April ran 85.0% on time against 77.4% across the year, JFK in April 81.6% against 74.3%, and Pittsburgh in April 85.3%. Boston and Philadelphia also beat their annual rates by several points, and even LaGuardia in April, usually the least reliable of the three New York airports, ran 76.5% against 72.4% for the year.
The Northeast is where the calendar matters most, because it is exposed to both of the bad seasons. Winter brings the coastal storms that produced February's cancellations; summer brings thunderstorms that cross the busiest airspace in the country and trigger ground delay programmes at all three New York airports at once. April sits between the two. About a third of Newark's April delay minutes were still charged to the National Airspace System, which is congestion rather than weather: the airports are busy even on a good day. But congestion alone costs far less than congestion plus storms.
The long routes out of the region benefited too. Los Angeles to Newark ran 88.3% on time in April, and Los Angeles to JFK 86.1%.
If I had an East Coast trip in spring and could move the dates, April is the month I would pick.
MarchApril
55.0%90.0%
Figures are on-time percentages. Source: US DOT Bureau of Transportation Statistics, September 2025 to August 2026.
Almost every airport here improved between March and April, most of them by several points. The exceptions are the ones to notice.
Where April went wrong
O'Hare stayed near the bottom. It ran 69.7% on time and cancelled a larger share of its schedule than any other big airport in April; only one other airport among the sixty, Milwaukee, cancelled more than two per cent. As in March, the regional flights carried it: SkyWest at O'Hare cancelled around one flight in sixteen and ran on time under two-thirds of the time, while United at O'Hare did far better. Chicago's spring weather likely lasts longer than the Northeast's, and in this data O'Hare did not get the April reprieve.
Texas started turning. Dallas Love Field in April ran 71.1% and Dallas-Fort Worth in April 73.9%, both below the level they held in the winter months. Half of DFW's April delay minutes were late-arriving aircraft, and the first spring storms over North Texas are the likely trigger: an afternoon cell over the airport delays the inbound aircraft, and every flight it operates afterwards inherits the delay. The May guide follows that pattern into the full convective season.
San Francisco is the strangest line in the chart. SFO in April fell to 74.7% on time after its best month of the year in March, and flights arriving there did far worse. Los Angeles to San Francisco, the busiest route into the airport, ran 48.6% on time in April, and Seattle to San Francisco 48.5%. When those figures first came out of the pipeline I took them for a bug in my aggregation. I checked them against the raw month files: the drop is in the data, and several routes into SFO stayed at roughly 35 to 50% on time through July. Across the year, more than half the delay minutes on those routes are charged to the National Airspace System, which usually means the airport is accepting fewer arrivals than airlines have scheduled. The data shows the drop clearly; it does not show the cause. The Bay Area guide explains why SFO's arrival rate is fragile in the first place, and why Oakland and San Jose often make the better choice. San Jose in April ran 84.2%.
Airlines in April
US average 79.8%
55.0%90.0%
Source: US DOT Bureau of Transportation Statistics, September 2025 to August 2026.
Delta Air Lines led at 85.0%. Delta's hub had a strong spring: Atlanta in April ran 82.1% on time, and the short Delta routes into Atlanta from the Southeast were among the most punctual in the country that month. Savannah to Atlanta ran 92.9% and Charleston to Atlanta 91.1%. Spirit Airlines was last at 65.4%, and the budget carriers generally trailed the network airlines, as they do in most months.
Easter
Easter moves between late March and late April, and this site measures Good Friday to Easter Monday against the weeks either side.
During the holidayNormal weeks either side
70.0%90.0%
All US flights. Normal weeks are the two weeks either side of the window, excluding other holidays. Source: US DOT Bureau of Transportation Statistics, September 2025 to August 2026.
In 2023, 2024 and 2025 Easter ran better than its surrounding weeks, by 7.1, 3.4 and 1.7 points. In 2026 (Friday 3 April to Monday 6 April 2026) it ran 78.2% on time, 1.9 points worse than its normal weeks, with 1.57% of flights cancelled against 0.92%. The site's test did not count 2026 as a measurable holiday effect.
The earlier years fit the explanation in the holidays guide: Easter likely thins out business travel without adding much leisure demand on the Friday and Sunday themselves. Why 2026 broke the pattern is not visible in the data, and one weak year after three good ones is thin evidence either way. The Easter overview and the 2026 page have the daily detail.
What I would book in April
Use April for the Northeast. If a New York, Boston or Washington trip can move from March or June into April, the data says do it. Newark's best and worst months were 15.9 points apart, and April sat near the top.
Avoid SFO arrivals until the pattern changes. At 48.6% on time from Los Angeles in April, I would not route a connection through San Francisco. Check the April figures on the SFO airport page and on your route before booking; San Jose and Oakland ran far better. If you must fly into SFO, check the hour pattern for your route with the best time to fly tool before choosing a flight.
Start watching Texas. April is the last month in which a Dallas connection is close to a winter-quality bet. Book the morning connection.
Do not fear Easter. In three of four years it beat its normal weeks, and it has never been a large cancellation event in this data.
Flying to Florida or Hawaii for a late spring break? The spring break guide covers the leisure airports in April in detail.
April by airport: Newark (EWR) · Washington Dulles (IAD) · JFK · Chicago O'Hare (ORD) · San Francisco (SFO) · Dallas-Fort Worth (DFW) · Atlanta (ATL) · Compare any US route