Guide
Flying in February: the quiet month with two weak spots
February 2026 ran 80.2% on time, second only to September. The trouble sat in two places: the Northeast's cancellations and Florida's peak season.

Across the whole country, February 2026 ran 80.2% on time. In this data only September did better, and February beat the 77.3% annual rate by a clear margin. It was also the lightest month of the year by total flights, helped by having only 28 days.
That combination explains most of it. Leisure demand is at its winter low once the holidays are over, and airlines likely trim frequencies to match. Fewer flights through the same runways, gates and air traffic sectors means shorter queues and more spare aircraft when something breaks.
February is the month the system has the most slack.
Two parts of the map did not share in it, and I would check both before booking.
Where February ran best
US average 80.2%
60.0%90.0%
Source: US DOT Bureau of Transportation Statistics, September 2025 to August 2026.
Ontario (ONT) led at 87.8%, followed by Albuquerque (ABQ) and San Jose (SJC). The top of the table is a mix of dry western fields and mid-sized airports in the middle of the country, all places where February brings neither convection nor heavy crowds. Omaha in February ran 86.9% against 80.7% for the year, and Albuquerque in February 87.3%, its best month.
Texas was in the best stretch of its year. Dallas-Fort Worth in February ran 78.9% on time; its best month of the whole year was February, and its annual rate is only 72.8%. The connection between the two Texas hubs, Dallas-Fort Worth to Houston Intercontinental, ran 86.4% on time in February against 70.7% across the year. The thunderstorm months are what pull the annual figure down.
Seattle was the other standout. Seattle in February ran 84.4%, and flights into it did even better: Las Vegas to Seattle managed 93.4%. Pacific Northwest winter weather is mostly rain and low cloud, which slows an airport without closing it.
The Northeast cancelled, Florida ran late
The bottom of the table splits into two groups that are connected by the same aircraft.
The first is the Northeast. JFK in February, LaGuardia in February, Boston in February and Newark in February each cancelled roughly one departure in twelve in February 2026, nearly double to triple their annual rates of 3.98%, 5.04%, 3.05% and 3.44%. That is the signature of winter storms along the coast, concentrated on a few days. Their on-time rates held up far better than their cancellation rates, for the reason the winter storm guide explains: the flights that would have run worst were removed from the schedule before they flew.
The second group is Florida. Fort Lauderdale finished last at 67.3%, and Orlando in February ran 72.9%, with Fort Myers and Palm Beach both in the bottom ten. February falls in Florida's dry season, so local weather is rarely the problem. What it has is peak season: winter visitors, school holidays, full aircraft and airports running at their busiest while the rest of the country is at its quietest.
The two problems feed each other. A large share of Florida's departures fly to the Northeast, and the aircraft flying them likely arrived from there. When a storm cancels a morning of flights at JFK or Boston, the aircraft and crews for the afternoon Florida departures are in the wrong place. Fort Lauderdale to JFK ran 59.1% on time in February and Boston to Fort Lauderdale 59.2%, both well below their already weak annual figures. At those rates I would not put a tight connection or a same-day commitment behind a February flight on that corridor.
Fort Lauderdale (FLL)70.4% overall
Orlando (MCO)74.6% overall
Boston (BOS)74.6% overall
New York (JFK)74.3% overall
All panels share one scale, 50% to 90% on time. Source: US DOT Bureau of Transportation Statistics, September 2025 to August 2026.
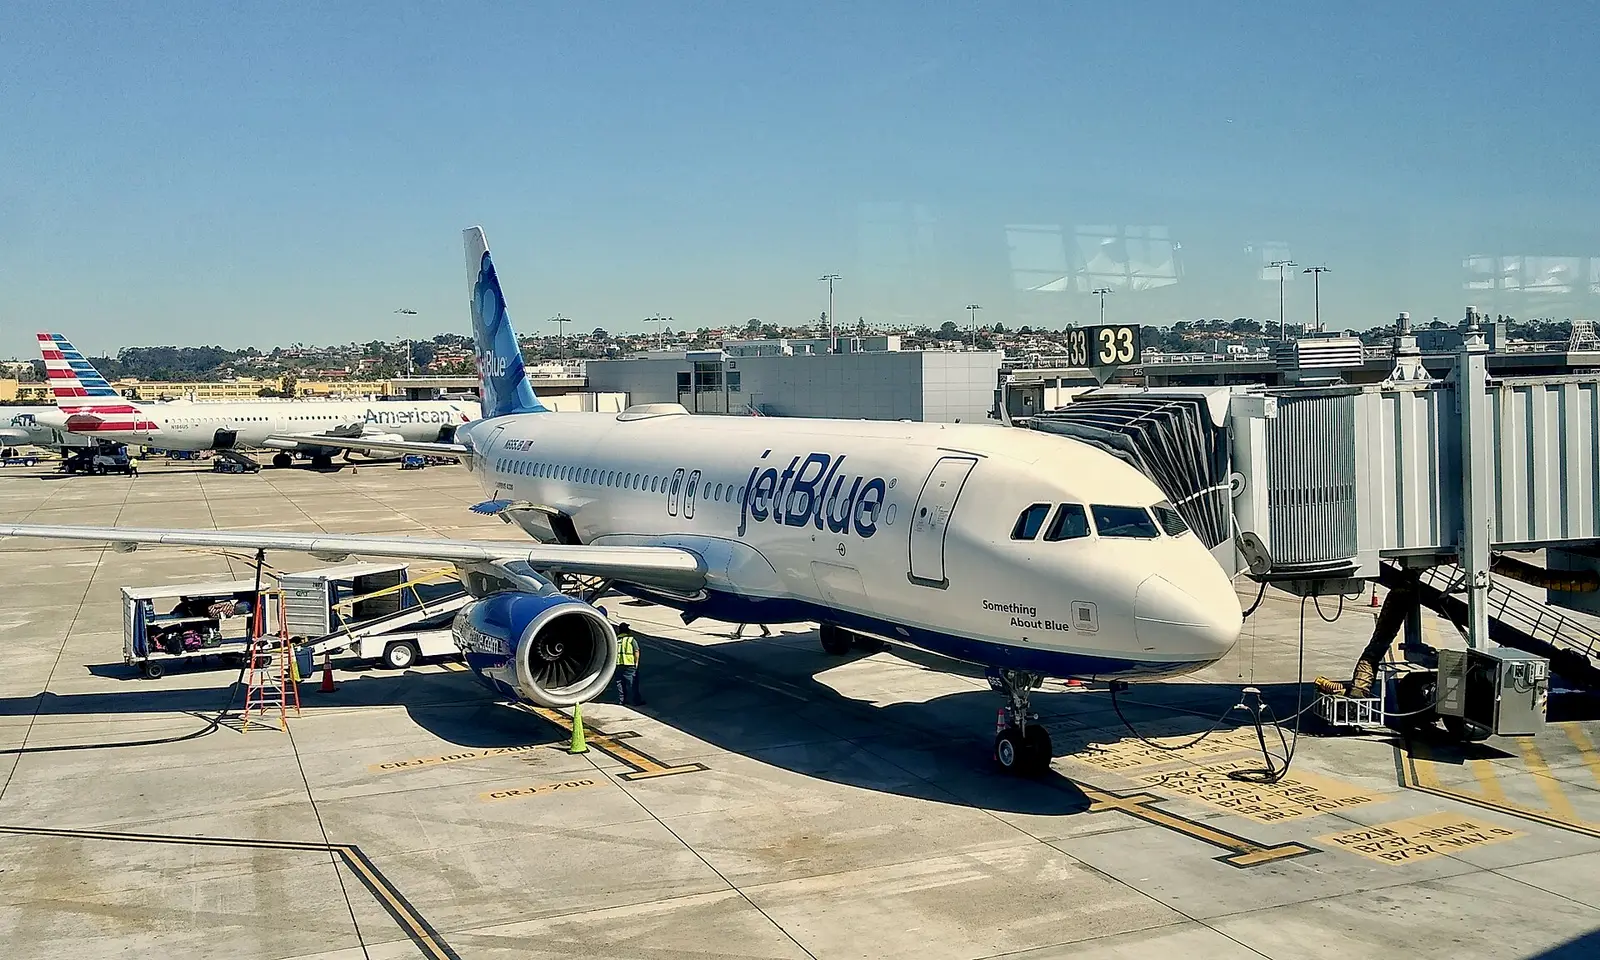
JetBlue, the airline most exposed to exactly that corridor, had the weakest February of any carrier at 67.7% on time. JetBlue at Fort Lauderdale and JetBlue at Boston are its two biggest operations alongside JFK, and both ran far below their annual averages.
US average 80.2%
60.0%90.0%
Source: US DOT Bureau of Transportation Statistics, September 2025 to August 2026.
At the top, United Airlines led at 84.2%. The month's trouble was regional rather than national, so an airline's February depended heavily on how much of its flying touched Florida and the Northeast.
Presidents Day weekend and the ski weeks
Presidents Day weekend is February's holiday and the peak of the ski season, as school winter breaks cluster around it.
During the holidayNormal weeks either side
55.0%90.0%
All US flights. Normal weeks are the two weeks either side of the window, excluding other holidays. Source: US DOT Bureau of Transportation Statistics, September 2025 to August 2026.
The 2026 weekend (Friday 13 February to Monday 16 February 2026) ran 78.2% on time, 2.4 points worse than the weeks around it, with 1.27% of flights cancelled against 2.59% in the normal weeks. The site's test did not count that as a measurable holiday effect. The 2026 page has the day-by-day record.
The 2025 weekend is the one to remember: 64.1% on time, 18.3 points worse than normal, the worst of the four on record here. The Presidents Day overview shows that three of the four years ran below their normal weeks. Four years is a thin sample, but the direction has been consistent, and it is the opposite of what the post-holiday lull would suggest. The likely reason is the ski traffic: a surge of flying into small mountain airports and through the hubs that feed them, at the height of the mountain snow season.
The mountain routes show it. Denver to Hayden, the airport for Steamboat Springs, ran 60.9% on time in February, and Los Angeles to Aspen 66.4%. These routes fly a hundred or two hundred times a month, so a few bad days move them a long way. The ski country guide covers which mountain routes hold up across the season. The hubs themselves were fine: Denver in February ran 82.4% and Salt Lake City 85.5%.
If I were booking February
February is the winter month to be flexible into. Nationally it ran 80.2% on time, against 79.2% in January and 73.2% in December. If a trip can move from the holidays into February, the odds improve. January was the harder month in another way: January 2026 had the year's highest national cancellation rate, and it was concentrated at Charlotte, Dallas-Fort Worth and Washington National rather than in the snow belt.
For Florida, fly early and avoid the Northeast connection when you can. At Fort Lauderdale the 5am–8am window runs 89.8% on time across the year against 58.0% for 8pm–5am. In February, with aircraft full, a missed evening flight home may not have a free seat until the next day. The South Florida guide compares Miami and Fort Lauderdale in more detail.
Watch Northeast forecasts even if you are not flying there. A storm in New York cancels Florida and Caribbean flights that never go near it. San Juan to JFK ran 71.6% on time in February.
For a ski trip on the holiday weekend, fly into the hub a day early. It is the one piece of February advice I would not skip. The big mountain hubs held up; the short hop into the resort airport is the weak link, and it has the fewest flights to rebook onto.
Use the Texas window. If you need to connect through Dallas or Houston, February is the month to do it. By May the May guide shows how quickly that changes. For March, see the March guide.
February by airport: Fort Lauderdale (FLL) · Orlando (MCO) · JFK · Boston (BOS) · Dallas-Fort Worth (DFW) · Seattle (SEA) · Ontario (ONT) · Compare any US route