Guide
How reliable is Delta? The on-time record, hub by hub
Delta arrived on time 81.1% of the time from September 2025 to August 2026, rank 1 of 14 US carriers. Where it runs best, where it slips, and which Delta flights to book.

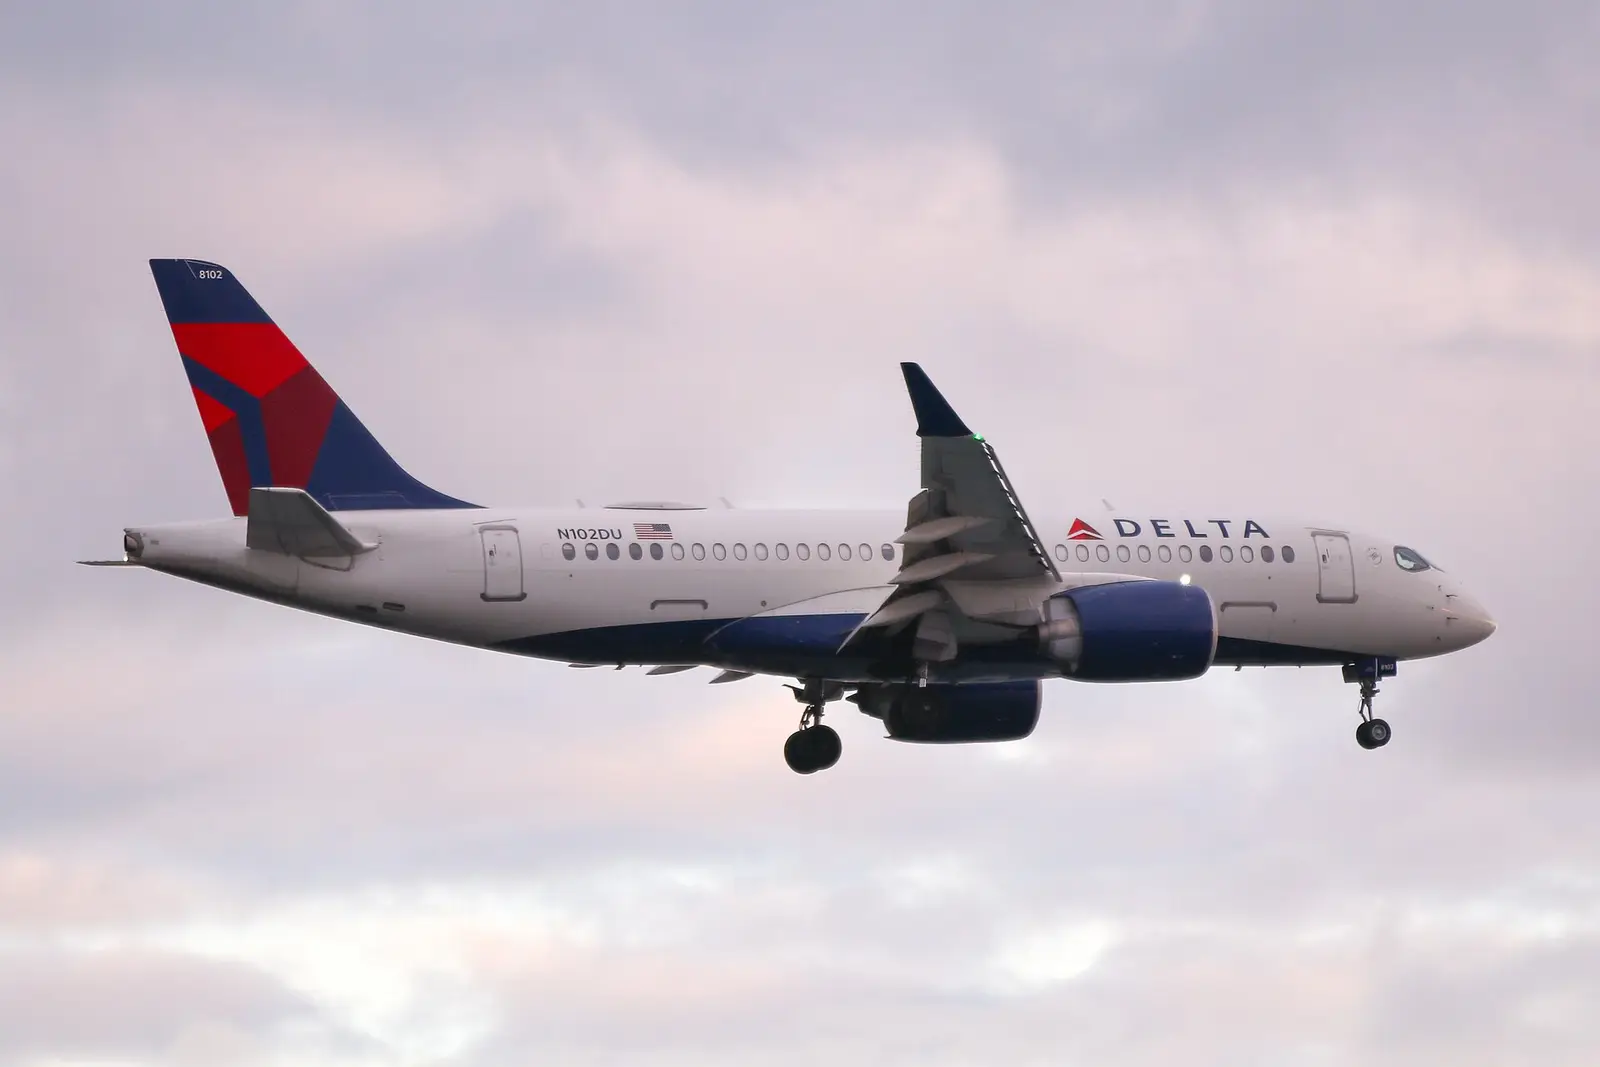
Delta flew 1,039,517 scheduled flights from September 2025 to August 2026 and 81.1% of them reached the gate on time, rank 1 of 14 US carriers and the best of the three big networks. United ran 78.8% and American 74.7%. The data confirms that headline. The rest is more mixed: Delta cancelled 1.74% of its schedule, more than United's 1.02%, and its record swings hard by airport, direction and hour.
The big three comparison sets Delta against its rivals; this guide stays with Delta.
Four measures
The on-time rank flatters Delta slightly. On the other three measures it sits closer to the middle.
US average 1.89%
0.00%5.00%
Source: US DOT Bureau of Transportation Statistics, September 2025 to August 2026.
Cancellations are the weak spot. Delta's 1.74% is below the national 1.89% but well above the lowest carriers, Allegiant Air at 0.68% and Hawaiian Airlines at 0.87%. A cancelled flight never enters an on-time rate, so part of any airline's punctuality is bought with the flights it chose not to fly. I never read one of those two figures without the other.
On long delays Delta is good, not exceptional. 6.7% of its flights arrived an hour or more late, against 8.3% nationally, and 35.4% of its late flights crossed that hour mark. Its late flights averaged 71 minutes behind schedule. Alaska and Southwest both keep their late flights shorter.
Atlanta and the other hubs
Roughly one Delta departure in four leaves Atlanta, so Atlanta sets the tone. The other hubs differ more than the network figure suggests.
US average 77.3%
65.0%90.0%
Source: US DOT Bureau of Transportation Statistics, September 2025 to August 2026.
Salt Lake City is Delta's best hub and one of the few big airports where it trails the local average, because the airport as a whole, at 84.2%, is one of the most punctual in the country. LaGuardia is the worst. Delta's departures there run below its network figure, and LaGuardia as a whole cancelled 5.04% of its flights. The highest cancellation rate of the 60 airports with pages belonged to New York (LGA), at 5.04%. Slot controls and two short, intersecting runways leave no room to recover a bad afternoon.
What stands out is Delta against its neighbours. At Atlanta the airport averaged 77.9% and Delta's own departures ran slightly better, even though Delta is most of the airport. At Minneapolis, Detroit, Kennedy and Boston, Delta also ran at or above the airport average. That is unusual.
The hubs guide found that at most hubs the visiting carriers beat the home team.
Delta's smaller stations are where it runs best. Its departures from Portland, San Diego and Phoenix were among its most punctual anywhere. These are mostly flights back to a hub, on aircraft that overnighted at the outstation or arrived early in the day.
Best and worst Delta routes
Across Delta's busiest routes, flights into Atlanta run better than flights out of it.
The Raleigh-Durham to Atlanta route is among Delta's best, and the route as a whole ran 86.5% on time. The return, Atlanta to Raleigh-Durham, ran 80.0% across all carriers. Largely the same aircraft fly both legs. A flight out of Atlanta leaves in a hub bank, queues for a runway with dozens of other departures, and inherits whatever delay its aircraft brought in. Indianapolis, Pittsburgh and San Juan to Atlanta also sit near the top of Delta's list. The opposite direction guide covers why this asymmetry appears all over the network.
The bottom of Delta's list is made of two kinds of route. The first is Atlanta to a congested or storm-prone airport. Atlanta to Washington National ran 68.7% for the route as a whole, Atlanta to Orlando 70.3% and Atlanta to O'Hare 69.0%. Washington National's capacity limits and Orlando's afternoon thunderstorms both land on flights that leave Atlanta late in the day. At 70.3% I would not put a tight connection behind an afternoon Atlanta to Orlando flight.
The second is anything into San Francisco. Los Angeles to San Francisco and Salt Lake City to San Francisco are Delta's two weakest busy routes. Both routes ran well under 60% on time for flights scheduled to leave between 8am and 11am: 49.8% for Los Angeles and 48.2% for Salt Lake City. Low cloud over the Bay regularly cuts San Francisco's arrival rate sharply in the morning, and a flight scheduled into that window waits on the ground at its origin.
The clock, the week and the calendar
Figures are on-time percentages. Darkest column is the best, lightest the worst. Source: US DOT Bureau of Transportation Statistics, September 2025 to August 2026.
Delta's day slopes like everyone's, but less steeply. Between 5am and 8am it ran 90.0% on time. Between 5pm and 8pm it ran 74.0%, against 68.0% for all US flights in that window. The gap from morning to evening, 16.0 points, is well under the national 21.3.
By weekday, Wednesday was Delta's best day at 85.3% and Sunday its worst at 76.5%. Nationally, Sunday was the worst day at 47 of the 60 airports with pages.
By month, September was the best at 87.6% and July the worst at 74.1%. July 2026 ran 74.1% and December 2025 74.5%, almost level with each other. Summer thunderstorms over Atlanta likely account for July; Atlanta's July page shows the airport's worst weeks. December is the holiday rush, and the 2025 Christmas and New Year window was hard on Delta's cancellation rate in particular. One year is one sample for each month, so a single bad storm can move these figures.
Why Delta's delays look different
Share of all delay minutes. Darker is a bigger share. Air traffic is the National Airspace System category; weather is extreme weather only.
Source: US DOT Bureau of Transportation Statistics, September 2025 to August 2026.
The cause split is the most distinctive thing in Delta's record. Airlines report 44% of Delta's delay minutes as the airline's own doing (crew, maintenance, cleaning, fuelling, baggage), against 33% nationally. Late-arriving aircraft account for only 29%, against 40% nationally.
I do not read that as a finding about Delta's operation. The cause codes are assigned by the airline, and Delta's hubs put more delay under "air carrier" and less under "late-arriving aircraft" than the national split does. To me that looks like a reporting convention. Endeavor Air, for its part, never appears as a separate carrier at Delta's hubs in this data.
A passenger can rely on the on-time rate and the hour curve, which do not depend on coding.
data/generated/airlines/DL.json, trimmed to the headline fields
{
 "flights": 1039517,
 "completed": 1018714,
 "onTimePct": 81.1,
 "veryLatePct": 6.7,
 "avgDelayMin": 71.2,
 "medianArrDelay": -8,
 "cancelPct": 1.74,
 "divertPct": 0.27,
 "causes": {
  "carrier": 0.4414,
  "weather": 0.0406,
  "nas": 0.2235,
  "security": 0.0008,
  "lateAircraft": 0.2937
 },
 "byHourBlock": [90, 86.1, 82.1, 76.6, 74, 76.1 ],
 "byMonth": [80.2, 83.3, 79.9, 85, 82.2, 82.3, 74.1, 78.4, 87.6, 84, 82.4, 74.5 ],
 "byDow": [79.3, 83.5, 85.3, 81.4, 80.2, 82, 76.5 ]
}
Percentages are shares of scheduled or completed flights as defined on the methodology page; byHourBlock runs 5am to overnight, byMonth January to December, byDow Monday to Sunday. Source: US DOT Bureau of Transportation Statistics, September 2025 to August 2026.
This is the file my pipeline writes for Delta each month, and Delta's network-wide figures on this page are recomputed from it.
The most and least reliable Delta flight numbers
Delta has more flight numbers with pages here than any other carrier, and the best follow one rule: early departures heading to a hub. DL 1270, the 5:45am from Portland to Salt Lake City, and DL 886, the 6am from Tucson to Atlanta, are among the most punctual flights in Delta's schedule. DL 3055 from Charleston and DL 1344 from Austin, both dawn departures to Atlanta, belong to the same group.
The least reliable leave Atlanta in the late afternoon or evening for a difficult airport. DL 2879, the 5:42pm to O'Hare, DL 2498, the 6:54pm to Newark, and DL 727, the 8pm to Washington National, sit at the bottom. DL 1742, the mid-afternoon Atlanta to Orlando, runs straight into Florida's storm hour. The flight numbers guide ranks every carrier's.
My rules for booking Delta
Fly into Atlanta early, out of it early. An inbound morning connection at Atlanta is one of the most reliable things Delta sells. An evening departure out of Atlanta to Washington, Chicago or Florida is one of the least.
Avoid mid-morning arrivals into San Francisco. If the trip allows, take the first flight of the day or a flight landing after midday.
Treat LaGuardia as a cancellation risk, not a delay risk. Delta's punctuality there is merely below average; the airport's cancellation rate is the real exposure. Keep a later option on the same day.
Check the operator. Delta Connection flights operated by SkyWest or Republic carry those airlines' records, not Delta's.
Use the tools for the specific trip. The best time to fly tool and connection risk tool apply these patterns to one route and one connection.
Delta's record in detail: Delta Air Lines · Delta at Atlanta · Delta at Salt Lake City · Delta at LaGuardia · The big three compared