Guide
The most and least punctual US airports, ranked
Flights leaving Salt Lake City (SLC) arrived on time 84.2% of the time, the best of the 60 busiest US airports. Fort Lauderdale (FLL) managed 70.4%. What separates the two ends.

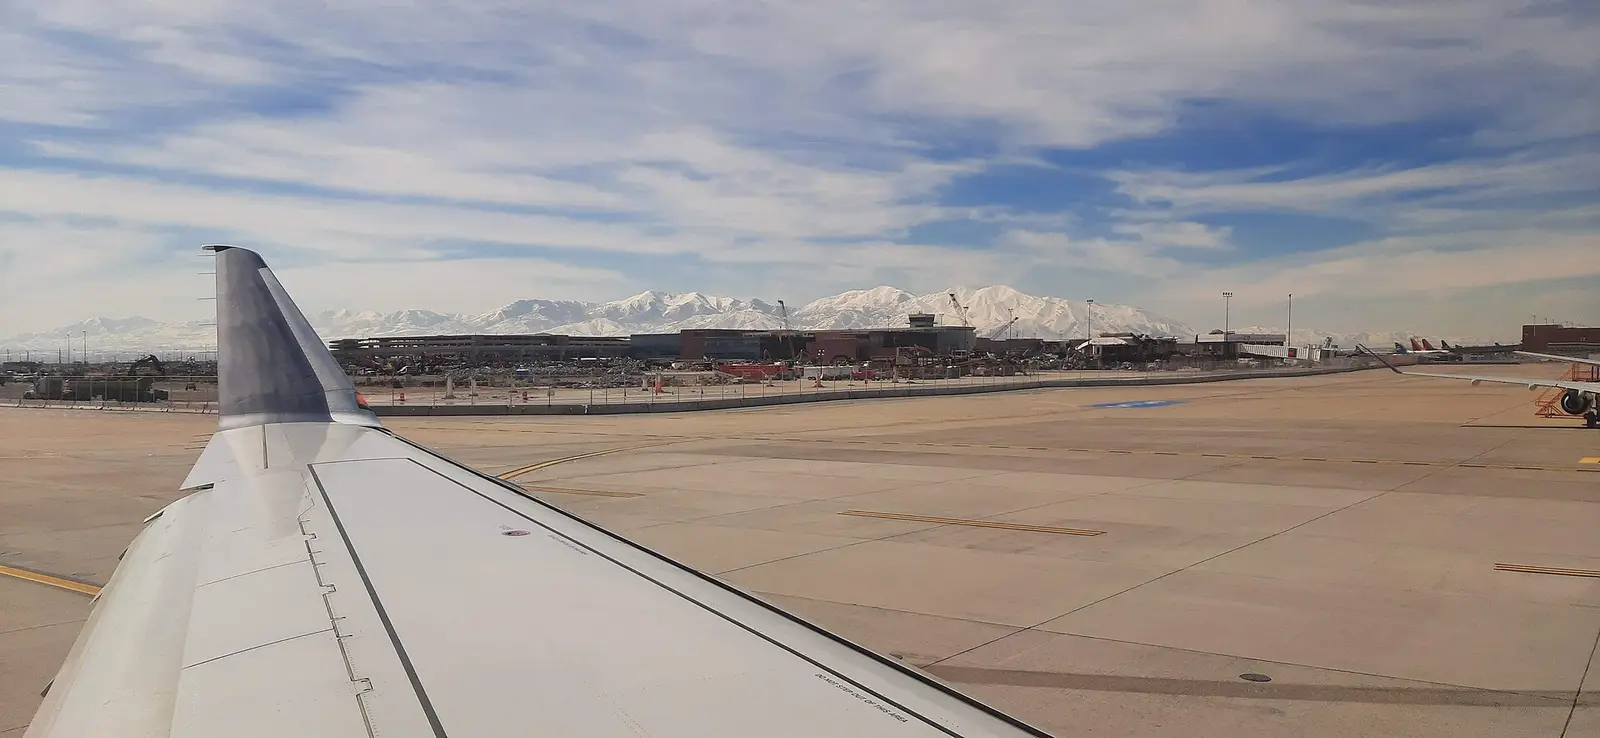
A flight leaving Salt Lake City (SLC) reached its gate on time 84.2% of the time from September 2025 to August 2026. A flight leaving Fort Lauderdale (FLL) managed 70.4%. That spread between airports is wider than the spread between the best and worst airlines, 81.1% against 71.3%.
Those are the two ends of a ranking of the 60 busiest US airports. The median airport sits at 78.0%, and 18 of the 60 cleared 80%.
The size of the table is a choice, and it was not always 60. When I cut at the top 50, Oakland and Palm Beach tied at exactly 31,406 flights, the tie broke against Oakland, its page dropped out, and the build failed because the Bay Area guide cited it. The cut was raised to 60 airports in September 2026.
What an airport's figure measures
Every airport figure on this site describes flights departing that airport, all airlines combined. The on-time rate is the DOT's arrival measure applied to those departures: a flight leaving Salt Lake City counts as on time if it reaches its destination gate less than 15 minutes after schedule, wherever that destination is. The cancellation rate is the share of scheduled departures that never left. The delay causes are the causes airlines reported for those same departures.
Arrivals into an airport are not in its figure. A flight from Chicago into Salt Lake City counts toward Chicago. That makes each number a direct answer to the question a traveller asks: if I fly out of here, how likely am I to arrive on time? The methodology page sets out the full definitions.
The top of the table
US average 77.3%
70.0%90.0%
Source: US DOT Bureau of Transportation Statistics, September 2025 to August 2026.
The top end is mostly western. Salt Lake City (SLC), Albuquerque (ABQ), Portland (PDX), San Jose (SJC), Sacramento (SMF), Burbank, Ontario and Santa Ana all sit in it, alongside both big Hawaiian fields, Honolulu (HNL) and Kahului. The West sees far fewer of the summer thunderstorms that close eastern airspace most afternoons, and California's fields almost never see snow.
Most of the rest of the airports above 80% are mid-sized fields in the middle of the country: Pittsburgh (PIT), Columbus, Indianapolis, Omaha, Kansas City, Memphis, with San Antonio close by. These airports have runway capacity well beyond their schedules. A late aircraft arrives, turns, and leaves without joining a departure queue.
Salt Lake City is the interesting case because it is a major Delta hub, and big connecting hubs often rank badly. Its evening departures (5pm to 8pm) run 79.4% on time against a national 68.0% for the same window, which is why its early-morning-to-evening drop is one of the shallowest of any airport, 12.0 points. A hub that holds its evening bank that well is consistent with slack built into the schedule, on the ground and in the air. Washington Dulles (IAD), a United hub at 81.0%, shows the same thing on the East Coast: Washington National (DCA), thirty miles away, runs 72.2%.
The bottom of the table
US average 77.3%
60.0%80.0%
Source: US DOT Bureau of Transportation Statistics, September 2025 to August 2026.
Three groups account for almost all of the bottom fifteen.
Florida. Fort Lauderdale (FLL), Miami (MIA), Orlando (MCO) and Palm Beach (PBI) all rank near the foot, and they lose ground in two seasons. From winter into spring break the schedules are full of leisure flying with no spare seats or aircraft: Fort Lauderdale ran 59.7% on time in March. In summer, convective storms build almost every afternoon, at the same hours as the heaviest departure banks, and Fort Lauderdale managed 62.8% in July. Its evening window runs 59.6% on time against 89.8% before 8am.
The congested Northeast. LaGuardia (LGA), Washington National, Boston (BOS), JFK and Philadelphia (PHL) share some of the most crowded airspace in the world. When low cloud or wind cuts an airport's arrival rate, the FAA meters traffic through ground delay programmes, and departures from every airport in the corridor wait for a slot at the other end.
Big connecting hubs and busy Southwest bases. Chicago O'Hare (ORD) and Dallas-Fort Worth (DFW) schedule hundreds of connections in tight banks, and flights wait for late inbound passengers and aircraft. Dallas Love Field (DAL), Chicago Midway (MDW) and Nashville are Southwest's intensively scheduled stations, where aircraft fly many short legs a day on quick turns. Late-arriving aircraft account for 50% of delay minutes at Love Field, against 40% nationally.
Much the same names head the list for flights an hour or more late: Chicago (ORD) at 12.1%, then Fort Lauderdale (FLL) and New York (LGA), against a median of 7.8%. For anyone connecting, that tail matters more than the headline rate.
Punctuality and cancellations are different rankings
US average 1.89%
0.00%6.00%
Source: US DOT Bureau of Transportation Statistics, September 2025 to August 2026.
The on-time rate counts only flights that operated, so cancellations are a separate ranking, and the two overlap only in part.
New York (LGA) cancelled 5.04% of its scheduled departures, the highest of the 60, followed by Washington (DCA) at 3.99% and New York (JFK) at 3.98%. The median is 1.52%. The high end is dominated by slot-controlled and capacity-limited airports in the Northeast. When a ground delay programme cuts the number of arrivals an airport can take, airlines cancel flights to fit, and they usually choose short regional hops where passengers can be rebooked on a later frequency.
Newark (EWR) is the clearest split. Its on-time rate of 77.4% sits close to the median, but it cancels 3.44% of departures. Denver (DEN) runs the other way: below-median punctuality at 76.6%, and one of the lowest cancellation rates of any airport, 0.78%, despite its winter storms. Oakland (OAK) cancelled least, at 0.61%.
The winter pattern surprised me. January 2026 had the highest national cancellation rate of the year, and it was concentrated at Charlotte, Dallas-Fort Worth and Washington National rather than in the snow belt.
A high cancellation rate can also flatter an on-time rate. The flights an airline cancels on a bad day are often the ones that would have run latest, and cancelled flights drop out of the on-time calculation. Read both columns before judging an airport.
Why the ends differ
Share of all delay minutes. Darker is a bigger share. Air traffic is the National Airspace System category; weather is extreme weather only.
| Late aircraft | Airline | Air traffic | Weather | |
|---|---|---|---|---|
| SLC | 26 | 46 | 21 | 6 |
| PDX | 36 | 36 | 25 | 3 |
| HNL | 33 | 53 | 11 | 3 |
| FLL | 40 | 31 | 25 | 4 |
| ORD | 42 | 27 | 21 | 10 |
| DFW | 47 | 31 | 14 | 8 |
| LGA | 42 | 25 | 29 | 4 |
| DCA | 49 | 25 | 20 | 6 |
Source: US DOT Bureau of Transportation Statistics, September 2025 to August 2026.
Cause shares show the mix of delay minutes, not their quantity. Salt Lake City's airline-attributed share is high at 46% because little else is going wrong: comparatively few of its delay minutes come from late-arriving aircraft. Honolulu's air traffic share is 11%, a sign of open airspace and uncongested runways.
At the weak end, different causes dominate different airports. O'Hare and Dallas-Fort Worth carry the largest extreme-weather shares in this group, 10% and 8%, consistent with winter storms in Chicago and spring and summer thunderstorms across North Texas. LaGuardia's air traffic share is 29%, the signature of flow control. Washington National's late-aircraft share of 49% shows delays arriving from elsewhere and being passed on. Most real weather delay is filed under air traffic and late aircraft, not under the extreme-weather category, so the weather column understates it everywhere.
How I would use the ranking
Where you have a choice of airport, it is worth points. Dulles against National, Oakland or San Jose against San Francisco: the hub against secondary airport guide covers the trade.
At a low-ranked airport, fly early. Most of the bottom fifteen lose their record in the afternoon and evening. Their first departures of the day often run close to the national early-morning figure of 89.3%.
For connections, check the tail. An airport's share of flights an hour or more late decides whether a tight layover survives. The missed connection guide ranks the hubs on it.
At a high-cancellation airport, avoid the last flight. At LaGuardia or National, a cancelled 8pm leaves nothing until morning. I would not book the last departure of the day from either if the trip had no slack.
Check the month. Each airport's weak spell falls somewhere different: Fort Lauderdale's worst month was March, Denver's June, O'Hare's December. The best and worst months by airport guide shows each airport's calendar.
Compare the ends: Salt Lake City (SLC) · Portland (PDX) · Fort Lauderdale (FLL) · Chicago O'Hare (ORD) · LaGuardia (LGA) · Compare any US route