Guide
Air traffic control delays, airport by airport
The air traffic system causes 21% of US delay minutes. At Columbus (CMH) it is 29.6%, at Kahului (OGG) 10.4%. Why a high share can still mean a punctual airport.

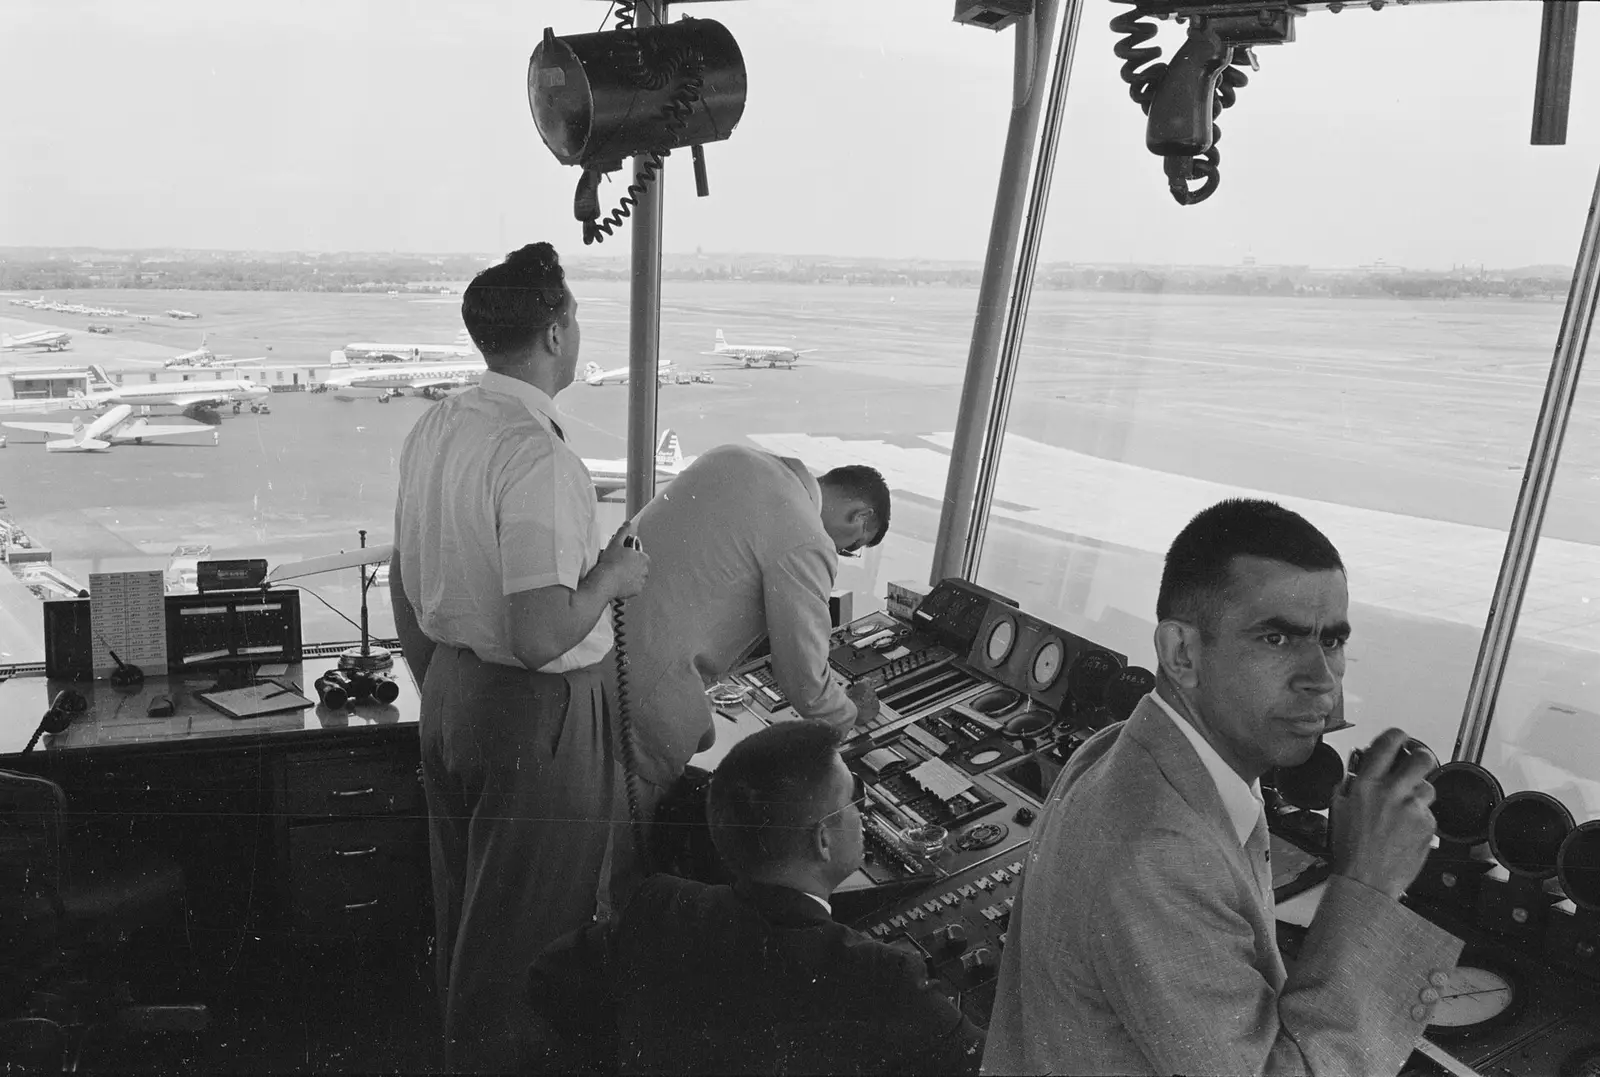
Ask which US airport loses the largest share of its delay to the air traffic system and most travellers would guess Newark or LaGuardia. In this data the answer is Columbus (CMH), where the DOT's "National Aviation System" category accounts for 29.6% of all delay minutes on departing flights. Newark and LaGuardia are close behind at 29% and 29%. Pittsburgh, at 29%, is also one of the more punctual airports in the country, at 80.7% on time.
Both facts are true at once. The reason is the most useful thing I know about delay-cause data.
What the category covers
When a flight arrives 15 minutes or more late, the airline assigns its delay minutes to five causes: the airline itself, a late-arriving aircraft, extreme weather, security, and the National Aviation System, or NAS. NAS is the air traffic system in the widest sense: controller-imposed restrictions, heavy traffic volume, airport operations such as a closed runway, and ordinary weather bad enough to slow the system but not extreme enough to count separately. A line of thunderstorms that forces the FAA to cut an airport's arrival rate from 40 an hour to 28 lands here. Nationally, NAS accounts for 21% of delay minutes, behind late-arriving aircraft (40%) and the airlines themselves (33%).
Most of it comes from two FAA tools. A ground stop halts departures bound for an airport that cannot take more arrivals, usually for an hour or two. A ground delay programme is the longer, planned version: the FAA assigns each inbound flight a later departure slot and holds it at its origin gate. The delay is served on the ground, where it burns less fuel and is safer than holding in the air.
That matters for reading any airport's figures. Airport figures on this site cover flights departing that airport, scored on arrival at their destination. A Pittsburgh departure held for 50 minutes by a Newark ground delay programme counts in Pittsburgh's NAS column, not Newark's.
The ranking
US average 21%
0%35%
Share of delay minutes on departing flights charged to the National Aviation System category. Source: US DOT Bureau of Transportation Statistics, September 2025 to August 2026.
Two groups share the top of this list, for opposite reasons.
The first is New York and Washington. Newark (29%), LaGuardia (29%), Kennedy (28%) and Dulles (29%) all sit well above the national share. The three New York airports share one packed block of airspace with interlocking paths, so a problem at one runway spreads to all three. They are among the most frequent subjects of ground delay programmes in the country, and their own departures queue for runways that run close to capacity for most of the day. Here the air traffic system is a large share of a large pile.
The second group is mid-sized airports in the Midwest and Ohio Valley: Pittsburgh, Columbus (30%), Indianapolis (29%), Cleveland (28%) and Cincinnati (27%). None of them is congested. Their departures fly largely to the big hubs and East Coast airports, where most ground delay programmes are issued, and their own operation generates little delay, so the air traffic delay they import becomes a large share of a small pile.
The same logic holds at route level. Among routes with 2,000 or more flights, the highest NAS share belongs to Portland (PDX) to San Francisco (SFO), at 64.7%, followed by Burbank (BUR) to San Francisco (SFO) and Columbus (CMH) to Boston (BOS). In this period the list is dominated by flights into San Francisco and O'Hare, both frequent subjects of ground delay programmes, and those routes collect their NAS minutes at the origin gate.
A share is not an amount
This is where travellers misread cause data. A share tells you what kind of delay an airport has.
It tells you nothing about how much.
US average 77.3%
65.0%85.0%
Each bar carries the airport's air-traffic share of delay minutes underneath. Source: US DOT Bureau of Transportation Statistics, September 2025 to August 2026.
Pittsburgh and LaGuardia have similar NAS shares. Pittsburgh ran 80.7% on time with 7.2% of departures arriving an hour or more late. LaGuardia ran 72.4% on time with 11.5% an hour late, and it cancelled 5.04% of its flights, against 2.16% at Pittsburgh. The same percentage of a much larger total is a much larger number of minutes spent waiting.
The airports where air traffic delay really costs travellers combine a high share with a poor on-time rate: Newark, LaGuardia and Kennedy, with Boston (27%, 74.6% on time) close behind. At the Ohio Valley airports I read the high share the other way round, as a sign that little else goes wrong.
Washington National is worth separating from Dulles. Its NAS share is 20%, close to the national figure, but it runs only 72.2% on time. Its delay is dominated by late-arriving aircraft, at 49% of delay minutes. That pattern is consistent with a slot-controlled airport whose schedule is capped near what the runway can handle: the queue is built into the timetable, and when one flight slips the next rotation inherits it.
The other end of the list
US average 21%
0%25%
Share of delay minutes on departing flights charged to the National Aviation System category. Source: US DOT Bureau of Transportation Statistics, September 2025 to August 2026.
Honolulu (11%) and Kahului (10%) sit at the bottom because inter-island flying sits outside the mainland's traffic flow programmes. When a Honolulu flight is late, the cause is usually the airline: 53% of its delay minutes are carrier-coded. San Juan (12%) is similar in structure, an island airport where late-arriving aircraft carry most of the delay.
Dallas-Fort Worth is the surprise. It is one of the busiest airports in the world and one of the least punctual on this site at 72.8%, yet the air traffic system accounts for only 14% of its delay minutes. The rest is late-arriving aircraft (47%) and the airlines' own operations (31%). DFW has seven runways; its problem is getting aircraft turned around, crewed and away on time. Charlotte (15%) and Phoenix (16%), also low, are American hubs too, which fits the airline figures: American's NAS share across its network is 14%, against 35% for United, whose hubs include Newark, San Francisco and Dulles.
Cause codes are partly a filing convention, and one pattern taught me that while building the pipeline. Endeavor Air never appears as a separate carrier at Delta's hubs in this data, and those hubs put more delay under "air carrier" and less under "late-arriving aircraft" than the national split. I read that as how the minutes are reported, not as a finding about Delta's operation.
Share of all delay minutes. Darker is a bigger share. Air traffic is the National Airspace System category; weather is extreme weather only.
| Late aircraft | Airline | Air traffic | Weather | |
|---|---|---|---|---|
| CMH | 36 | 30 | 30 | 4 |
| PIT | 36 | 29 | 29 | 5 |
| EWR | 37 | 27 | 29 | 6 |
| IAD | 33 | 31 | 29 | 8 |
| LGA | 42 | 25 | 29 | 4 |
| JFK | 36 | 31 | 28 | 4 |
| BOS | 43 | 28 | 27 | 2 |
| DCA | 49 | 25 | 20 | 6 |
| DFW | 47 | 31 | 14 | 8 |
| SJU | 52 | 35 | 12 | 1 |
| HNL | 33 | 53 | 11 | 3 |
Rows ranked by the air traffic share. Source: US DOT Bureau of Transportation Statistics, September 2025 to August 2026.
Where NAS delay hides
The NAS share understates how much the air traffic system shapes a day. An aircraft held 90 minutes at Chicago by a LaGuardia ground delay programme arrives late in New York, and its next departure, to Atlanta, is coded as late-arriving aircraft, not NAS. Some share of the national 40% started as an air traffic restriction somewhere upstream. The cause codes record the proximate cause of each flight's delay, not the original one.
How I check an air-traffic-heavy trip
Before you leave for the airport, check the live FAA picture. This site's live airport status page shows current ground stops and ground delay programmes from the FAA feed. A ground delay programme at your destination means your flight will leave late even if the weather at your origin is perfect, and it usually tells you the average delay being assigned. (That feed refused my Python fetcher with HTTP 403 while curl on the same server got 200; its edge fingerprints the TLS handshake, so the page now uses curl.)
Treat a high NAS share at a small airport as a warning about your destination. From Pittsburgh or Columbus, the delay you are most exposed to is the one waiting at Newark, LaGuardia or O'Hare. A connection through Charlotte or Atlanta may avoid it entirely.
In New York, book early departures and avoid tight connections. Ground delay programmes are typically issued for the afternoon and evening, when demand peaks and summer storms arrive, so a morning departure often leaves before the programme starts. At 77.4% on time, I would not put a tight connection behind an afternoon Newark departure.
Do not read a low NAS share as a clean bill of health. Dallas-Fort Worth stays out of the air traffic column and still runs late. On-time rate first, causes second.
Compare the airports: Newark (EWR) · LaGuardia (LGA) · Kennedy (JFK) · Pittsburgh (PIT) · Dallas-Fort Worth (DFW) · Live FAA airport status