St. Louis, MO · departure reliability
STL
St. Louis Lambert International
- Departures
- 63,718
- Period
- June 2025 to May 2026
- Carriers
- 10
- US rank
- #31 by volume
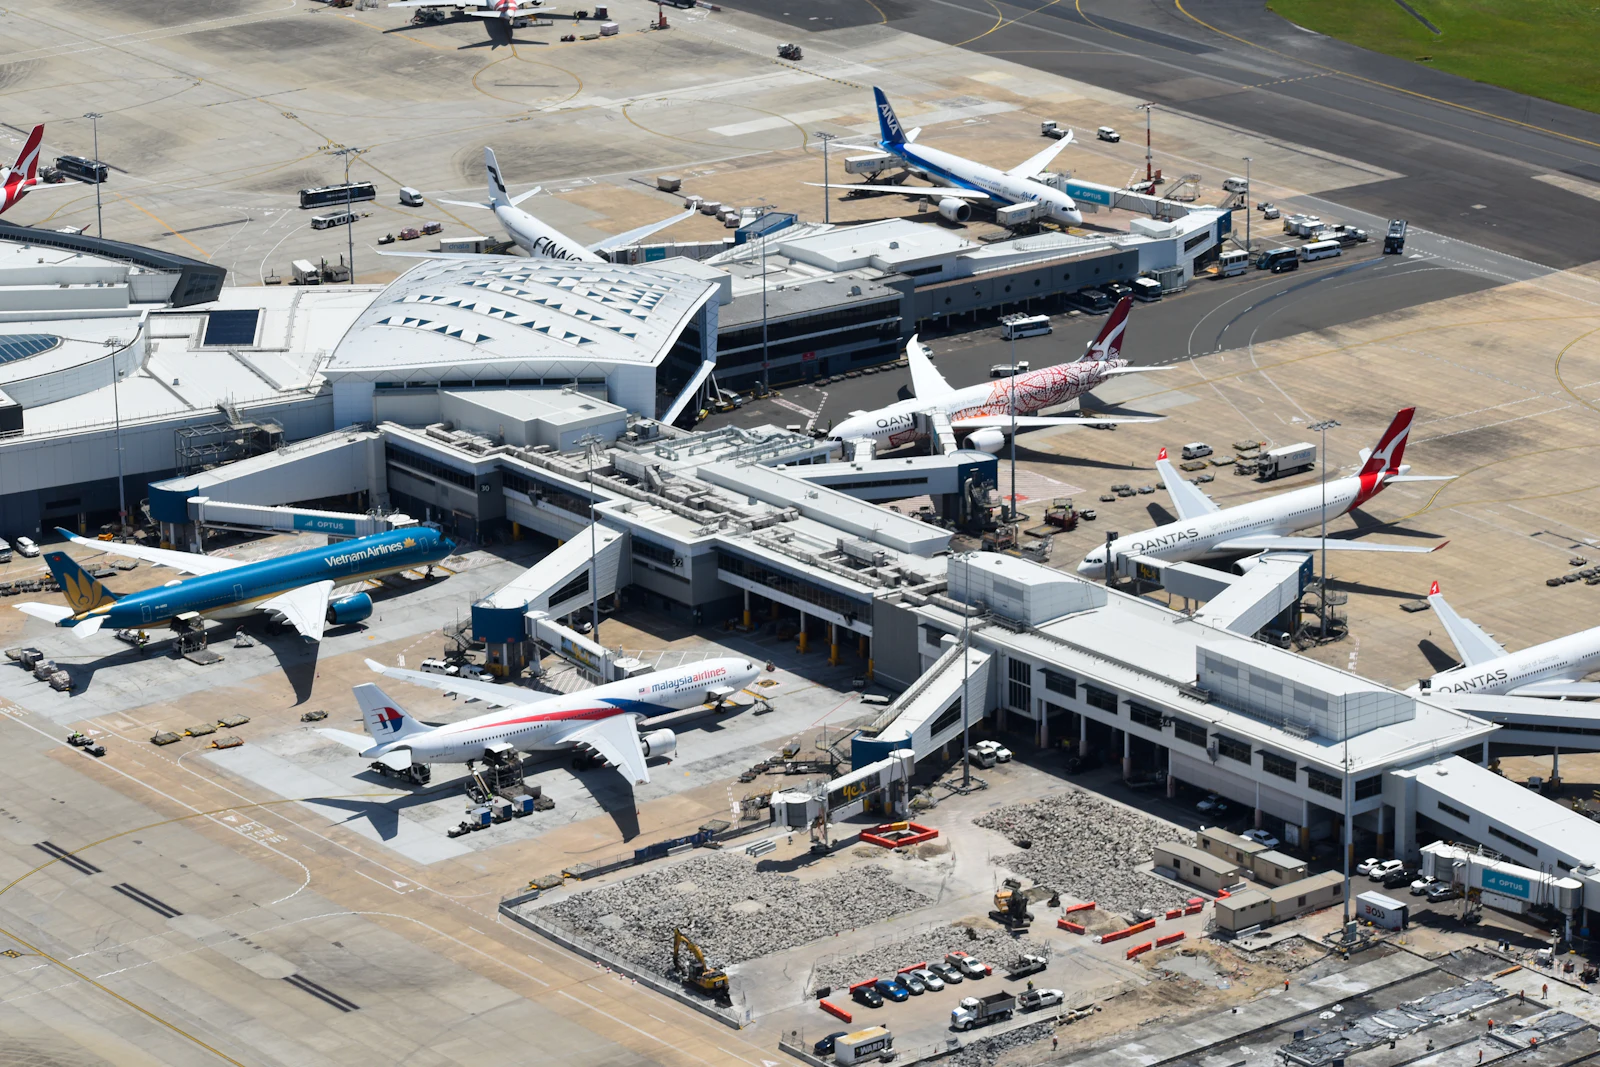
St. Louis
St. Louis Lambert International lands a B, about a point better than the national rate of 77.4%. About one flight in five arrive 15 minutes late or worse, and those flights are late by a little over an hour on average. That is a workable record, not a spotless one. That rests on 63,718 flights, of which Delta Air Lines flew 5,334 at 87.9% on time.
Delta Air Lines is the most reliable of the ten carriers covered here at 87.9% on time across 5,334 flights.
Key figures
On time
78.3%
Departures arriving under 15 minutes late at their destination
Avg delay
70 min
Across delayed flights only
Cancelled
1.26%
National rate is 1.80%
Best carrier
Delta
87.9% on time here
These figures cover 64,000 flights between June 2025 and May 2026. The median arrival is 6 minutes early, which is the part an average hides: most flights here are fine, and the on-time rate is decided by a tail of badly late ones. On-time means under 15 minutes late, the DOT's own threshold.
Carrier by carrier
Which airlines run best out of STL
The choice of carrier is not cosmetic here. Delta Air Lines arrives on time 87.9% of the time; SkyWest Airlines manages 68.9%. Sample sizes sit next to every figure, because a two-point gap across 2,412 flights means less than a ten-point one.
| Airline | Flights | On time | Avg delay | Cancelled | Grade |
|---|---|---|---|---|---|
| Southwest Airlines | 40,057 | 77.7% | 56 min | 0.66% | B+ |
| American Airlines | 5,818 | 80.3% | 118 min | 1.91% | B |
| Delta Air Lines | 5,334 | 87.9% | 88 min | 1.56% | A |
| Republic Airways | 3,164 | 79.7% | 83 min | 4.71% | B− |
| SkyWest Airlines | 2,412 | 68.9% | 100 min | 2.49% | C |
| United Airlines | 2,293 | 72.9% | 84 min | 0.70% | C+ |
| Envoy Air | 1,626 | 77.3% | 82 min | 2.03% | B |
| Frontier Airlines | 1,270 | 72.8% | 98 min | 1.97% | C |
| PSA Airlines | 803 | 77.5% | 129 min | 5.85% | B− |
| Alaska Airlines | 800 | 78.7% | 53 min | 1.12% | B |
PSA Airlines cancels 5.8% of what it schedules here, the highest in the table. A cancelled flight never appears in an on-time rate, so read that column alongside the punctuality one rather than after it.
Route by route
Busiest routes out of STL
Route-level records vary far more than the airport average. These are the 25 busiest departures from STL, each with its own on-time rate against the airport-wide 78.3%.
| Route | Flights | On time | Avg delay | Cancelled | Grade |
|---|---|---|---|---|---|
| STL to ATL · Atlanta | 3,718 | 85.1% | 72 min | 1.75% | A |
| STL to DEN · Denver | 3,636 | 74.9% | 73 min | 0.33% | C+ |
| STL to ORD · Chicago | 3,060 | 71.2% | 94 min | 2.91% | C |
| STL to LGA · New York | 2,660 | 74.7% | 69 min | 4.06% | C− |
| STL to MCO · Orlando | 2,494 | 77.8% | 62 min | 0.88% | B+ |
| STL to DCA · Washington | 2,410 | 72.9% | 78 min | 2.61% | C |
| STL to DFW · Dallas-Fort Worth | 2,358 | 74.4% | 108 min | 3.14% | C− |
| STL to PHX · Phoenix | 2,287 | 76.4% | 77 min | 0.44% | B+ |
| STL to LAS · Las Vegas | 2,053 | 78.5% | 65 min | 0.49% | B+ |
| STL to DAL · Dallas | 1,916 | 77.4% | 59 min | 1.57% | B |
| STL to DTW · Detroit | 1,908 | 82.6% | 86 min | 1.05% | B |
| STL to MSP · Minneapolis | 1,875 | 80.4% | 78 min | 0.91% | B+ |
| STL to CLT · Charlotte | 1,827 | 83.1% | 104 min | 1.37% | B |
| STL to MDW · Chicago | 1,706 | 80.6% | 55 min | 1.06% | B |
| STL to BOS · Boston | 1,612 | 70.8% | 66 min | 1.49% | C |
| STL to PHL · Philadelphia | 1,572 | 79.3% | 86 min | 1.53% | B |
| STL to HOU · Houston | 1,546 | 79.8% | 55 min | 0.32% | B+ |
| STL to BWI · Baltimore | 1,288 | 80.9% | 61 min | 1.16% | B |
| STL to BNA · Nashville | 1,269 | 83.1% | 56 min | 0.71% | B+ |
| STL to TPA · Tampa | 1,225 | 78.8% | 54 min | 0.65% | B+ |
| STL to MIA · Miami | 1,123 | 83.7% | 60 min | 0.80% | B+ |
| STL to EWR · Newark | 1,060 | 81.2% | 98 min | 4.81% | B− |
| STL to LAX · Los Angeles | 1,029 | 74.1% | 63 min | 0.19% | C+ |
| STL to MCI · Kansas City | 1,020 | 76.2% | 56 min | 0.29% | B+ |
| STL to RSW · Fort Myers | 1,007 | 78.4% | 50 min | 0.50% | B+ |
Departure window
The best time of day to leave STL
Departure time matters more here than the choice of carrier. The gap between the best and worst window is 25 points, against 19 points between the best and worst carrier. Each bar is the on-time rate for flights scheduled inside that window.
- 5am–8am11,916 flights89.7%
- 8am–11am14,778 flights87.4%
- 11am–2pm7,873 flights78.8%
- 2pm–5pm10,295 flights72.3%
- 5pm–8pm11,463 flights68.2%
- 8pm–5am7,393 flights65.2%
Scale runs 55% to 95%. Rows with fewer than 30 flights show a dash.
Book the early departure. Flights leaving between 5am–8am arrive on time 89.7% of the time, against 65.2% for the overnight window. That is 25 points of difference for no extra money, and it comes from the same aircraft having had no earlier flight to fall behind on.
Across the year
When STL runs late
STL's year swings by 13 points from best month to worst, which is wide. An annual average tells you very little about the week you are actually flying, so read the strip rather than the headline if your dates are fixed.
July is the worst month at 71.7% on time, 13 points below February, the best at 84.9%. Summer afternoon convection and peak-season schedules land on the same weeks every year, so this is a pattern you can book around rather than a run of bad luck.
Across the week, Wednesday is the strongest day at 83.0% on time and Sunday the weakest at 73.6%. 9 points is a smaller lever than departure hour, but it is free.
Delay causes
Why STL gets delayed
One category carries most of the weight here. Late-arriving aircraft accounts for 45% of the 953,000 delay minutes carriers reported, and the remaining four split what is left. The split is by minutes rather than by flights, so a few very long delays count for as much as many short ones.
- 45%Late-arriving aircraft
- 31%Carrier
- 20%National Airspace System
- 4%Extreme weather
- 0%Security
45% of delay minutes trace back to a late-arriving aircraft, meaning the plane was already behind before it got here. That is a cascade, and cascades start small and grow through the day. Across 953,000 reported delay minutes here, that single category outweighs weather by 10 to one. It is the strongest argument for booking the first departure of the morning, when the aircraft has been sitting at the gate overnight with nothing to inherit.
The practical consequence: the 5am–8am departure is the one that starts clean. Its aircraft has no earlier leg to be late from, which is exactly why that window shows 89.7% on time here.
Cancellations sit at 1.26% against a national 1.80%, which is ordinary. Diversions add another 0.28%.
7.4% of arrivals land an hour or more late, close to the national 8.2%. That is the figure that decides a connection, and it says a 60 to 75 minute layover is reasonable here while anything under 45 minutes is a bet. Most delays on this route are the a little over an hour kind, which a normal layover absorbs.
63,718 flights sit behind these numbers, which is a large enough sample that the headline rate is not moving on noise. Where a sub-group falls below 30 flights the site shows a dash instead of a percentage.
What to do with this
Flying out of STL
Put together: the calendar is the biggest lever here, not the carrier or the hour. February runs 84.9% on time and July 71.7%, a swing of 13 points. If the dates move at all, move them out of July before you think about anything else.
Common questions
STL delay questions
How often is St. Louis (STL) delayed?
About one flight in five arrive at least 15 minutes late, which is the Department of Transportation's definition of a delayed arrival. That works out to 21.7% of the 63,718 flights in this analysis, against 22.6% nationally. Delayed flights are late by a little over an hour on average.
Which airline is most reliable on St. Louis (STL)?
Delta Air Lines leads at 87.9% on time across 5,334 flights. SkyWest Airlines is at the other end on 68.9%, a gap of 19 points. Sample size matters as much as the percentage: a rate built from a few hundred flights moves around far more than one built from ten thousand.
What time of day has the fewest delays on St. Louis (STL)?
The 5am–8am departure window is the strongest at 89.7% on time. The 8pm–5am window is the weakest at 65.2%, 25 points behind. Later departures inherit delays from earlier flights the same aircraft has already flown, which is why the curve slopes the way it does.
How bad are July delays on St. Louis (STL)?
July is the weakest month at 71.7% on time, compared with 84.9% in February. Across the year that is 13 points between the best and worst months. Moving flexible dates out of that month is one of the few things that reliably helps.
Related
Where to go next
Source: US DOT Bureau of Transportation Statistics, on-time performance data, June 2025 to May 2026. Updated monthly. How this data is collected.