Guide
How reliable is United? Its on-time record, hub by hub
United ran 78.8% on time and cancelled just 1.02% of flights from September 2025 to August 2026. Its delays come from the airspace around its hubs more than from its own operation.

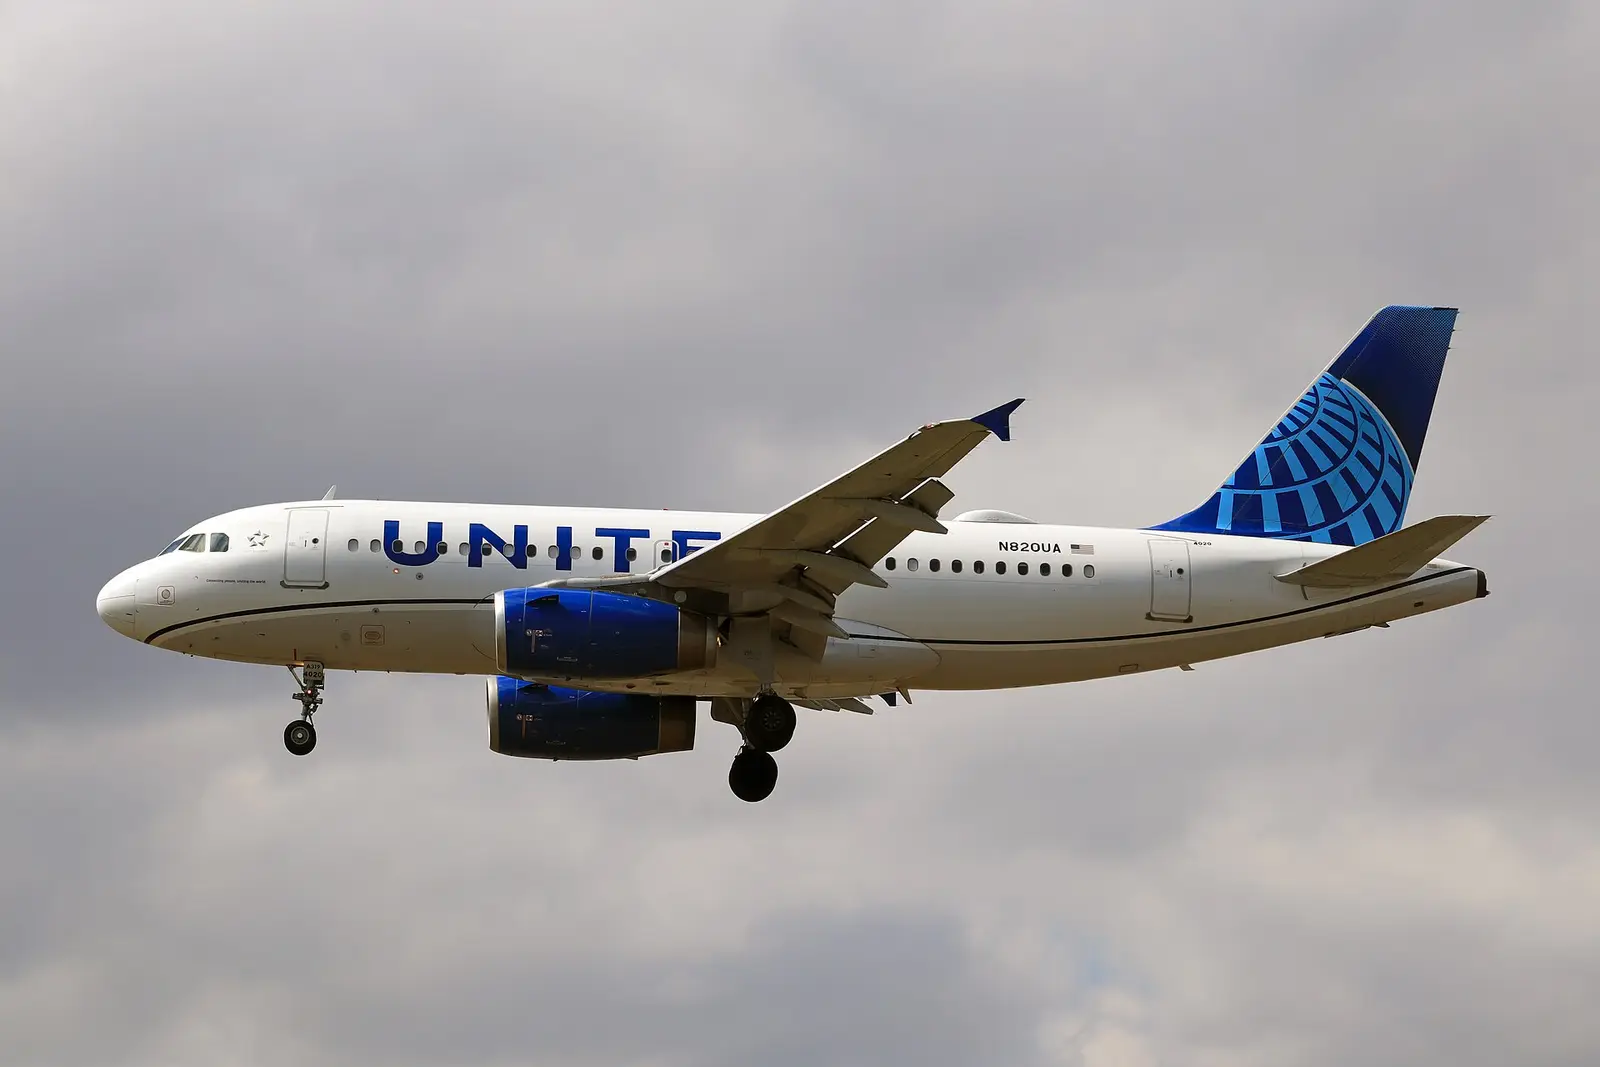
United cancelled 1.02% of its scheduled flights from September 2025 to August 2026, the lowest rate of the three big network airlines by a wide margin: Delta cancelled 1.74% and American 2.14%. On arriving on time, United ranked 5 of 14 at 78.8%, behind Delta and ahead of American. For a traveller that combination means something specific. A United flight is less likely than most to be cancelled, and quite likely to be late in a way the airline cannot fix.
The big three comparison puts the carriers side by side.
On the two long-delay measures United sits in the middle of the 14 carriers. 7.8% of its flights arrived an hour or more late, against 8.3% nationally, and 36.8% of its late flights crossed the hour, close to Delta's 35.4%. Its late flights averaged 73 minutes behind schedule. The airline rankings guide shows all four tables.
United's delays belong to the airspace
The DOT's cause codes make United's record unusual. Airlines report 35% of United's delay minutes under the National Aviation System category, which covers air traffic control programmes, runway capacity and ordinary weather. Nationally that share is 21%. Only 25% of United's delay minutes were put down to the airline's own operation, against 33% nationally.
Share of all delay minutes. Darker is a bigger share. Air traffic is the National Airspace System category; weather is extreme weather only.
Source: US DOT Bureau of Transportation Statistics, September 2025 to August 2026.
This is geography. United's hubs are Newark, O'Hare, San Francisco, Denver, Houston Intercontinental and Washington Dulles, and three of them sit in the most capacity-constrained airspace in the country. When the FAA runs a ground delay programme at Newark or San Francisco, United flights wait at their origins for an arrival slot. That minute is charged to the system, not the airline. The ATC delays guide ranks the airports where that category dominates.
The practical point: a United delay is often a flow-control hold rather than a broken aircraft, and it moves with every other flight into the same airport.
The hubs
US average 77.3%
65.0%85.0%
Source: US DOT Bureau of Transportation Statistics, September 2025 to August 2026.
Washington Dulles is United's most punctual hub, and O'Hare its least. O'Hare as a whole ran 70.8% on time, among the weakest airports in the country, and United's departures there ran a little better than that. Denver, United's busiest airport (and, by departures in this data, busier than Atlanta), sits close to the network figure, with a strong morning and weak summer afternoons.
Newark is the odd one. It is the only United hub where United's departures trailed the airport's own average of 77.4%, and United's Newark flights cancelled at more than twice its network rate. At every other hub United ran at or above the local average, which is not the usual result for a hub carrier.
San Francisco needs two readings. United's departures from SFO ran well: an aircraft leaving San Francisco has already landed, and afternoons there are usually clear. Arrivals into SFO are another matter, and they appear on the route pages rather than the airport one.
The San Francisco arrival problem
San Francisco's closely spaced parallel runways lose capacity when low cloud or fog stops side-by-side approaches. It happens most mornings in summer and it cuts the arrival rate sharply until the marine layer burns off. Flights bound for SFO in that window are held at their origin.
The route pages show it. Flights from Los Angeles to San Francisco scheduled to leave between 8am and 11am ran 49.8% on time across all carriers. From Denver, the same window ran 54.8%. The Denver to San Francisco route, O'Hare to San Francisco, Newark to San Francisco and Seattle to San Francisco are all among United's weakest busy routes. The return legs out of SFO do far better. The Bay Area airports guide covers the airport side.
The spring of 2026 was worse than the usual pattern. From April to July several routes into SFO fell to roughly 35 to 50% on time; Denver to San Francisco ran 39.4% in June 2026. I took it for a bug in my aggregation at first; checked against the raw month files, it is in the data. The data does not say why.
United's best and worst routes
The best United routes connect Houston with Los Angeles and feed Denver from the West Coast. Los Angeles to Houston ran 84.6% on time as a route and Houston to Los Angeles 84.1%. Portland to Denver, Sacramento to Denver and Seattle to Denver sit at the top of United's own list. They share a pattern: calm origins, a hub with room to spare when they land, and no slot-controlled airport at either end.
The worst are the shuttles between its eastern hubs and New York. The O'Hare to LaGuardia route ran 66.6% for all carriers and cancelled 5.29% of flights; LaGuardia to O'Hare was no better. Newark to O'Hare and O'Hare to Newark run a few points higher. Both ends of those routes suffer congestion, so a delay at either is a delay for the flight.
The clock, the week and the calendar
United Airlines78.8% overall
Delta Air Lines81.1% overall
American Airlines74.7% overall
All panels share one scale, 60% to 90% on time. Source: US DOT Bureau of Transportation Statistics, September 2025 to August 2026.
United's calendar is the most unusual of the three. Its best month was February, at 84.2%, in the middle of winter. Its worst was August, at 71.9%, and June 2026 ran 74.7%. Summer is thunderstorm season at Denver, Chicago, Houston and across the Northeast approaches, which is where United flies, while a winter without a major storm at its hubs lets its low cancellation rate show. One winter is one sample; the Denver January page and O'Hare February page show how much each hub's winter varies.
By time of day, United ran 89.6% on time between 5am and 8am and 69.2% between 5pm and 8pm. Its late-evening window, 8pm onward, recovered to 75.0%, likely because many of those flights are long overnight sectors, including red-eyes from Hawaii and the West Coast, with generous scheduled times. Tuesday was United's best day at 82.7% and Sunday its worst at 75.4%.
The most and least reliable United flight numbers
United's most punctual flights leave early and fly into a hub, or into San Francisco before the fog window. UA 596, the 5:30am from Las Vegas to Denver, and UA 2375 from Portland to Denver are among the best in its schedule. UA 487, the 5am from Houston, lands in San Francisco before the morning arrival restrictions usually bite. UA 2308, the overnight from Lihue to Denver, shows how well a padded red-eye can do.
The least reliable cluster around Chicago in the evening. UA 2497, the 5:15pm from Dulles to O'Hare, UA 661, the 4:45pm from Newark to O'Hare, and UA 2148 and UA 1369, the 6pm flights each way between Washington National and O'Hare, sit at the bottom. The route for Dulles to O'Hare ran 45.6% on time in that 5pm to 8pm window.
I would not put a connection behind any of them.
data/generated/airlines/UA.json, trimmed to the headline fields
{
 "flights": 830825,
 "completed": 819606,
 "onTimePct": 78.8,
 "veryLatePct": 7.8,
 "avgDelayMin": 72.8,
 "medianArrDelay": -6,
 "cancelPct": 1.02,
 "divertPct": 0.33,
 "causes": {
  "carrier": 0.2476,
  "weather": 0.0414,
  "nas": 0.3471,
  "security": 0.0001,
  "lateAircraft": 0.3638
 },
 "byHourBlock": [89.6, 84.4, 80.5, 73.2, 69.2, 75 ],
 "byMonth": [82, 84.2, 79.1, 82.6, 80, 74.7, 73.4, 71.9, 83, 80.4, 79.3, 77.2 ],
 "byDow": [77.7, 82.7, 80.9, 78.1, 77.5, 79.9, 75.4 ]
}
Percentages are shares of scheduled or completed flights as defined on the methodology page; byHourBlock runs 5am to overnight, byMonth January to December, byDow Monday to Sunday. Source: US DOT Bureau of Transportation Statistics, September 2025 to August 2026.
This is United's file as the pipeline writes it. If I were choosing United for a trip that has to happen on the day, cancelPct is the field I would read first.
How I would fly United
Choose United when cancellation is the bigger risk. For a trip that must happen on the day, United's cancellation rate is the strongest of the big three.
Route around O'Hare in the evening. If you connect through Chicago, do it before midday. Denver and Houston are the steadier connecting hubs, and Dulles the steadiest of all.
Do not schedule an SFO arrival for a mid-morning meeting. Land before 8am or after midday, or fly into San Jose or Oakland if the fare allows.
At Newark, expect both holds and cancellations. United's Newark departures cancelled at twice its network rate, and its long ground holds start there too. Keep a same-day backup, and use the connection risk tool before booking a tight connection.
Check the operator. United Express flights flown by SkyWest or Republic carry those airlines' records. On regional routes, compare the carriers on the route page before booking.
United's record in detail: United Airlines · United at Denver · United at O'Hare · United at Newark · United at San Francisco · The big three compared