Guide
Flying to Orlando: which routes run on time, and the flight home
Flights from Atlanta to Orlando ran 70.3% on time from September 2025 to August 2026; from Houston, 83.2%. How to pick the route, the hour and the airport for a theme park trip.

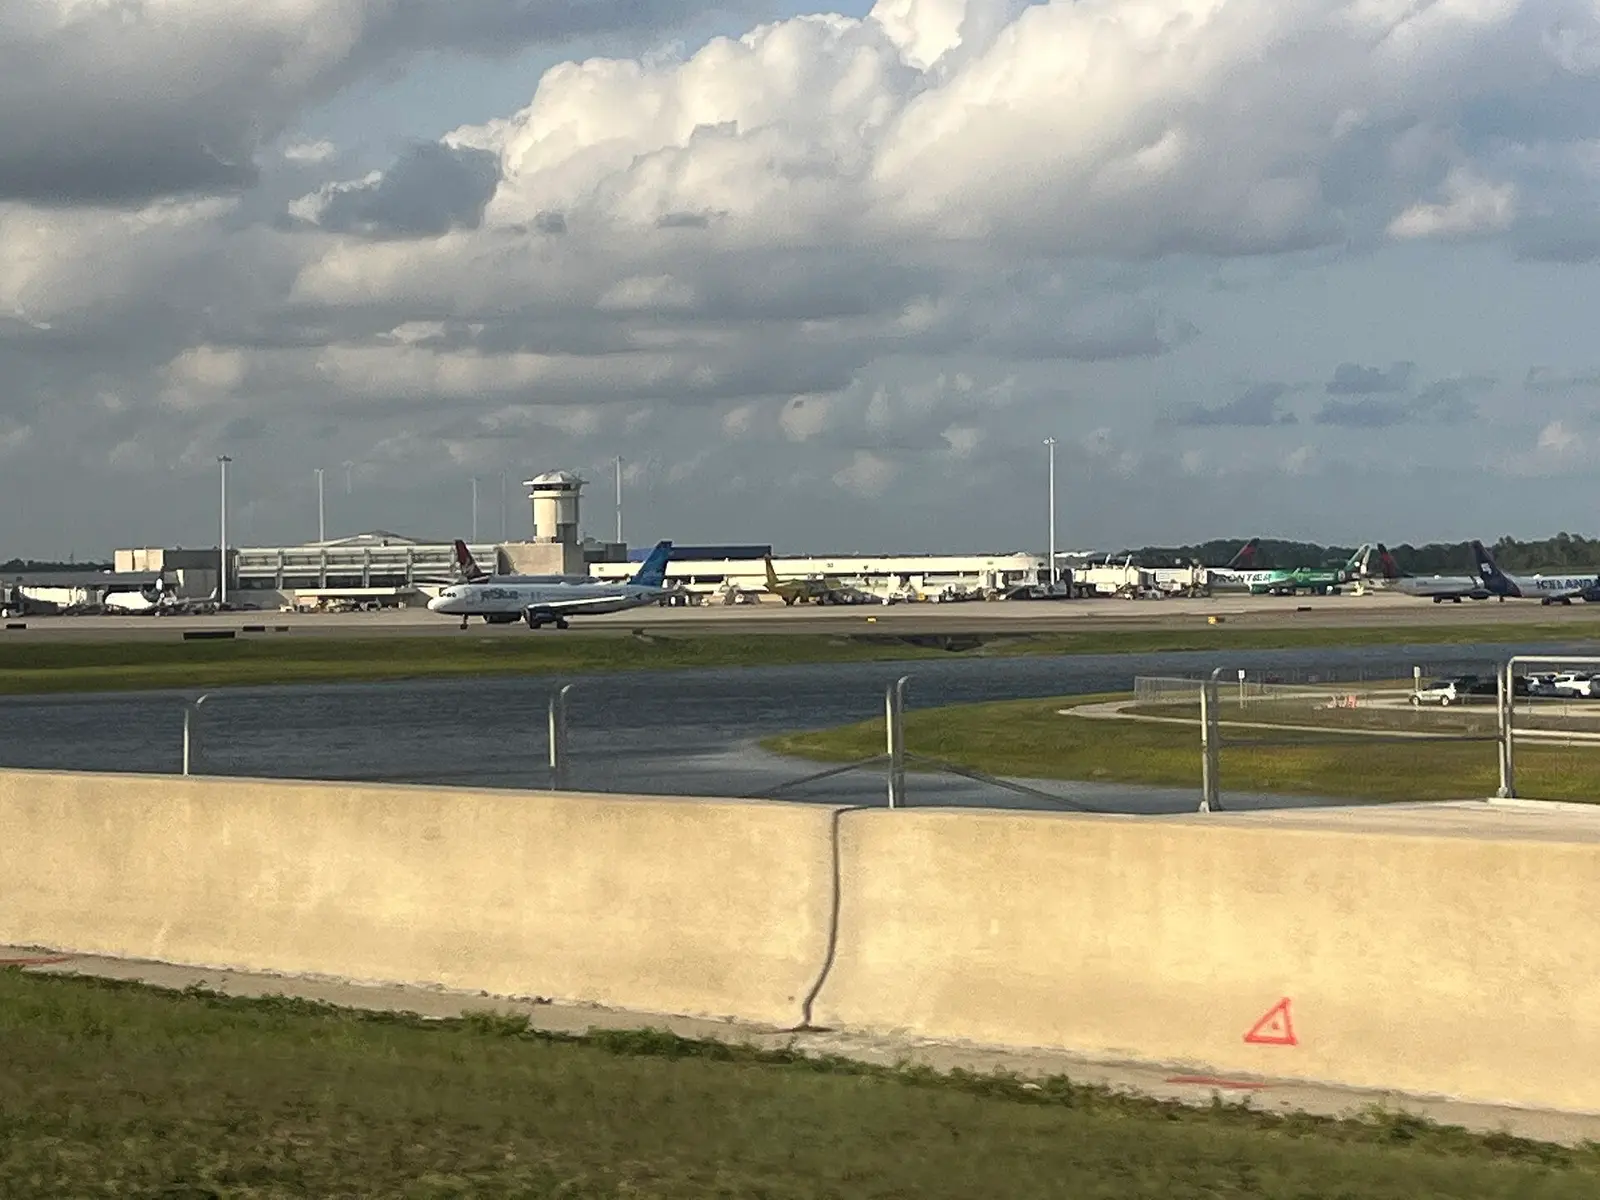
Orlando International ranks 50 of 60 US airports for on-time departures, at 74.6%, and the busiest route into it, from Atlanta, ran worse still: 70.3% from September 2025 to August 2026. Travellers heading for the parks tend to book the cheapest nonstop at the most convenient hour.
In Orlando both choices carry a real cost.
The spring break guide covers March and April across Florida, and the South Florida guide the Miami and Fort Lauderdale trade. This guide is about getting to Orlando and back.
The routes into Orlando, ranked
US average 77.3%
55.0%90.0%
Routes with at least 2,000 scheduled flights a year. On-time arrival rate at Orlando. Source: US DOT Bureau of Transportation Statistics, September 2025 to August 2026.
The best busy routes into Orlando start at two United hubs. The Houston Intercontinental to Orlando route ran 83.2% on time and Dulles to Orlando 80.7%. Flights from Pittsburgh, Indianapolis and Cleveland run close behind. Among the smaller routes, the long flights from the West did better still: San Francisco to Orlando ran 86.0% and Salt Lake City to Orlando 83.0%.
The worst are the short hops from southern hubs and the flights from the congested Northeast. Dallas-Fort Worth to Orlando ran 64.5% on time, the weakest busy route into the city. Atlanta to Orlando, the busiest route of all at 8,267 flights, ran 70.3%, and Charlotte to Orlando 71.6%. From the Northeast, LaGuardia and Boston both ran near 70.1%, and LaGuardia cancelled 4.68% of its Orlando flights.
Distance is not the explanation. The Atlanta hop is barely an hour, and it runs worse than the flight from Denver. What the weak routes share is an origin with its own afternoon storms or its own congestion, so the aircraft reaches Orlando already late, into Orlando's own afternoon.
The afternoon storm
5am–8am5pm–8pm
40.0%100.0%
Figures are on-time percentages. Source: US DOT Bureau of Transportation Statistics, September 2025 to August 2026.
Central Florida builds thunderstorms on most summer afternoons, as sea breezes from both coasts meet over the peninsula. When a cell sits over the airport, arrivals are held and the ramp closes for lightning. That is the Orlando version of a pattern the summer thunderstorm guide covers nationally, and it lands on the inbound flights hardest.
On the Atlanta route, flights leaving between 5am and 8am ran 85.6% on time and flights leaving between 5pm and 8pm 56.0%. From Dallas-Fort Worth the evening window ran 50.5%. Even the good routes lose ground: from Houston, 94.4% early against 78.7% in the evening.
data/generated/routes/ATL-MCO.json, trimmed to the headline fields
{
 "flights": 8267,
 "completed": 8107,
 "onTimePct": 70.3,
 "veryLatePct": 11.6,
 "avgDelayMin": 74.8,
 "medianArrDelay": -1,
 "cancelPct": 1.58,
 "divertPct": 0.35,
 "causes": {
  "carrier": 0.3826,
  "weather": 0.0305,
  "nas": 0.2501,
  "security": 0.0002,
  "lateAircraft": 0.3365
 },
 "byHourBlock": [85.6, 84, 77, 60.9, 56, 62.9 ],
 "byMonth": [75.1, 73.4, 65, 77.4, 72, 73.3, 56, 61.6, 79.2, 68.8, 74.6, 68.5 ],
 "byDow": [68.5, 77.1, 77.9, 71.1, 68.7, 66.5, 62.9 ]
}
Percentages are shares of scheduled or completed flights as defined on the methodology page; byHourBlock runs 5am to overnight, byMonth January to December, byDow Monday to Sunday. Source: US DOT Bureau of Transportation Statistics, September 2025 to August 2026.
This is the file the pipeline writes for the Atlanta route; the hour and weekday figures I quote for it are its byHourBlock and byDow rows, recomputed every month.
The calendar amplifies it. Across the routes into Orlando, July and August were the weak months, and the Orlando August page shows departures at their worst of the year. September 2025 was one of the best months, as it was nationally, with the September page showing the recovery. Winter and spring have their own dips: Orlando was hit hard during the spring 2026 break window, with cancellations far above normal, and during Christmas and New Year 2025. One year of each is one sample.
When families fly
On-time percentage. Darker means more delays; the best cell in each row is outlined.
| Mon | Tue | Wed | Thu | Fri | Sat | Sun | |
|---|---|---|---|---|---|---|---|
| ATL–MCO | 69 | 77 | 78 | 71 | 69 | 67 | 63 |
| EWR–MCO | 75 | 83 | 84 | 79 | 78 | 76 | 71 |
| ORD–MCO | 71 | 79 | 79 | 78 | 69 | 70 | 66 |
| SJU–MCO | 77 | 81 | 81 | 79 | 81 | 75 | 73 |
| PHL–MCO | 71 | 82 | 83 | 72 | 69 | 69 | 64 |
| LGA–MCO | 65 | 73 | 76 | 70 | 74 | 72 | 60 |
| JFK–MCO | 67 | 79 | 82 | 75 | 78 | 72 | 64 |
| BOS–MCO | 66 | 73 | 80 | 72 | 70 | 69 | 57 |
Source: US DOT Bureau of Transportation Statistics, September 2025 to August 2026.
Orlando's worst periods line up with its busiest. School holidays fill the parks at Christmas, in spring and through July, and those were three of the weakest stretches of the year on the routes in. The week follows suit. Sunday was the worst day on most busy routes into Orlando: on the Atlanta route, Sunday arrivals ran 62.9% on time against 77.9% on Wednesdays, and from Newark 71.4% against 84.4%. Tuesday and Wednesday were the best days to arrive almost everywhere.
That is the trade for a theme park trip. The days that fit a school calendar and a weekly hotel rate are the days the airline system is most stretched. Where a family can shift the arrival to midweek, the data says the flight is more likely to land when the tickets expect.
The carrier on the busy routes
On Orlando's busiest routes the choice of airline moves the odds more than the fare suggests. On Newark to Orlando, United ran ahead of JetBlue and Spirit (Spirit's filings stop in early May 2026, so its figure has no June or July flights in it). On O'Hare to Orlando, United ran well ahead of American. On Atlanta to Orlando, Southwest beat both Delta and Frontier. From Dallas-Fort Worth, American's flights were the least punctual option on a route that is weak for everyone. Given any other choice of origin or carrier, that is the flight I would avoid.
MCO average 74.6%
60.0%85.0%
Carriers with at least 1,000 scheduled flights at the airport. Source: US DOT Bureau of Transportation Statistics, September 2025 to August 2026.
The other Orlando airports
Two smaller airports serve the same trip. Orlando Sanford, north-east of the city, is Allegiant's main Orlando base; its departures ran 70.5% on time and cancelled only 0.65%. It has no route pages here yet, so compare it through the airline.
Melbourne, on the Space Coast, is smaller still but has two route pages, and they tell a clear story. The Atlanta to Melbourne route ran 83.8% on time against 70.3% for Atlanta to Orlando, and Charlotte to Melbourne ran 78.8% against 71.6% for Charlotte to Orlando. A small airport with a few flights a day does not queue. The samples are small, 1,451 and 1,114 flights, and the drive to the parks is longer, but for a cruise from Port Canaveral Melbourne is closer anyway.
The flight home
Orlando's departures fall off sharply through the day: 92.0% on time between 5am and 8am, 62.0% between 5pm and 8pm and 60.8% after 8pm. Sunday was the worst day to leave, at 67.0%, and it is a common day for families to fly home.
The best routes home go west: Orlando to Salt Lake City ran 82.5%, Orlando to Houston 83.5% and Orlando to Denver 80.3%. The worst go north-east: Orlando to LaGuardia ran 67.5%, Orlando to Washington National 70.0% and Orlando to Buffalo 66.4%. Those flights likely meet ground delay programmes at the other end, and the evening ones are the aircraft's last leg of a stormy day. On Orlando to LaGuardia, Delta ran far ahead of American and JetBlue.
What I would book for Orlando
Fly in before noon. Park tickets, dinner reservations and hotel check-in all assume you arrive on time. A morning arrival leaves the storm hours as slack.
Do not book a park day on arrival day. With evening departures from Atlanta running 56.0% on time, I would not plan anything on arrival day that cannot move. The first day belongs to the journey.
Pick the carrier on the route page, not the fare page. On Orlando's busiest routes the gap between carriers is often wider than the gap between Orlando and the national average of 77.3%.
Go home midweek, in the morning. Wednesday was the best day to leave Orlando, at 82.1%, and Sunday evening is the worst slot of the week. The best time to fly tool shows the hour on your exact route, and the trip planning guide covers buffers for fixed events such as a cruise.
Plan the trip: Orlando (MCO) · Atlanta to Orlando · Newark to Orlando · Orlando to LaGuardia · Spring break flying · Compare any US route