Guide
San Diego airport delays: how reliable is flying out of SAN?
San Diego ran 76.3% on time over September 2025 to August 2026, rank 44 of 60, off one runway. Its worst route is the one to San Francisco, and the fog causing it is not San Diego's.

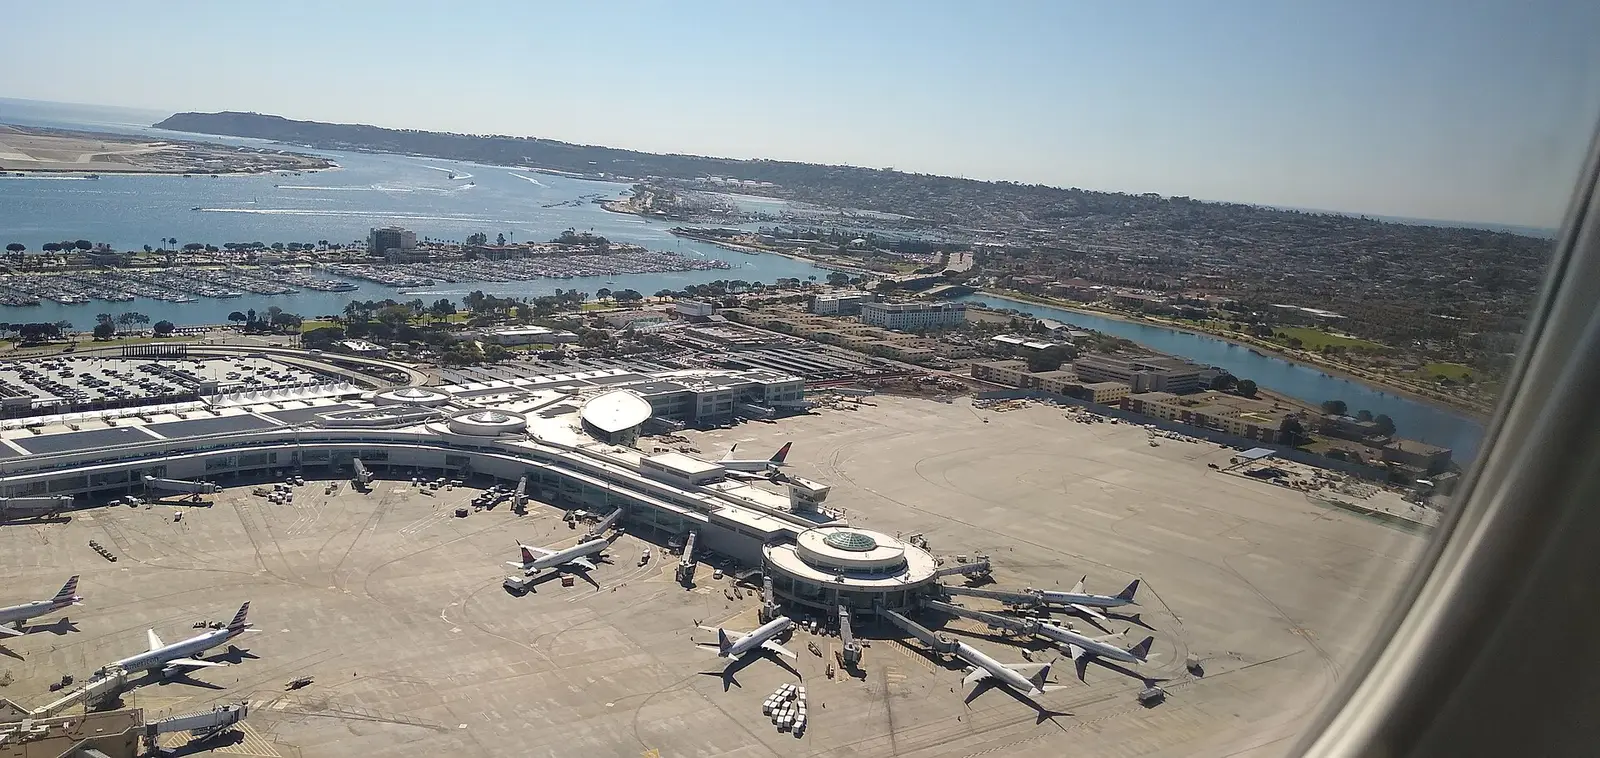
San Diego International moves 101,169 scheduled departures a year off a single runway, which makes it one of the busiest single-runway airliner airports in the country. There is no second strip to open when the schedule backs up, no crosswind alternative, and a city wrapped tight around three sides of the field. Over September 2025 to August 2026, 76.3% of its departures arrived on time, rank 44 of 60 airports on this site and slightly below the national 77.3%.
The rest of the record is gentler than the rank. San Diego cancelled only 1.27% of its flights against 1.89% nationally, 7.1% arrived an hour or more late, and its late flights averaged 61 minutes behind against 73 for all US flights. SAN is late fairly often and rarely by much.
As everywhere on this site, the figures cover departures from the San Diego airport, scored on arrival.
data/generated/airports/SAN.json, trimmed to the headline fields
{
 "flights": 101169,
 "completed": 99477,
 "onTimePct": 76.3,
 "veryLatePct": 7.1,
 "avgDelayMin": 61.1,
 "medianArrDelay": -5,
 "cancelPct": 1.27,
 "divertPct": 0.4,
 "causes": {
  "carrier": 0.2604,
  "weather": 0.0393,
  "nas": 0.2161,
  "security": 0.0021,
  "lateAircraft": 0.4821
 },
 "byHourBlock": [89.6, 82.8, 73.5, 67.1, 67.9, 75.6 ],
 "byMonth": [83.1, 84, 78.2, 80.8, 76.9, 71.1, 68.1, 64.9, 81.9, 79, 77.1, 75.4 ],
 "byDow": [74.1, 82.9, 81.3, 71.1, 71.3, 83, 72.8 ]
}
Percentages are shares of scheduled or completed flights as defined on the methodology page; byHourBlock runs 5am to overnight, byMonth January to December, byDow Monday to Sunday. Source: US DOT Bureau of Transportation Statistics, September 2025 to August 2026.
This is the file my pipeline writes for San Diego, trimmed to the headline fields; every San Diego figure in this guide is recomputed from it when a new DOT month arrives.
A Southwest airport that runs below Southwest
More than a third of SAN's departures are Southwest at San Diego. Next come SkyWest, which flies regional jets for United, Delta, Alaska and American, then Alaska at San Diego, United at San Diego, Delta at San Diego and American at San Diego.
SAN average 76.3%
60.0%90.0%
Departures from SAN. The dashed line is the airport average. Source: US DOT Bureau of Transportation Statistics, September 2025 to August 2026.
In this period Delta led the airport by a distance and Southwest sat near the bottom of the big carriers, below Southwest's own network average of 75.7%. That matters because Southwest is the airport's volume: when its San Diego operation runs behind, so does the headline. That is less unusual than it sounds: the hub guide finds airlines trailing their own network at 17 of the 37 airports where one of them flies 30% or more of the departures.
The delay causes show the mechanism. Late-arriving aircraft account for 48% of San Diego's delay minutes, one of the highest shares among the 60 airports and well above the national 40%. A single runway turns a late inbound into a late outbound with no slack in between, and Southwest's short turns and multi-city rotations carry that delay through the day.
Share of all delay minutes. Darker is a bigger share. Air traffic is the National Airspace System category; weather is extreme weather only.
| Late aircraft | Airline | Air traffic | Weather | |
|---|---|---|---|---|
| SAN | 48 | 26 | 22 | 4 |
| US | 40 | 33 | 21 | 6 |
Shares of delay minutes reported by the airlines. Source: US DOT Bureau of Transportation Statistics, September 2025 to August 2026.
The afternoon trough, then a recovery
Figures are on-time percentages. Darkest column is the best, lightest the worst. Source: US DOT Bureau of Transportation Statistics, September 2025 to August 2026.
Before 8am SAN runs 89.6% on time. The curve bottoms out in the 2pm to 5pm window at 67.1%, then does something most airports do not: it climbs again, to 67.9% between 5pm and 8pm and 75.6% after 8pm. After 8pm the schedule is a mix: the red-eyes to New York, Boston, Charlotte and Atlanta ran well, with long scheduled times that absorb a late push-back, and they lift the block above the evening's last short hops to San Francisco, Sacramento and Las Vegas. The afternoon is when Southwest's short-haul rotations to Las Vegas, Phoenix and the Bay Area are at their most tangled.
The best single flights are the dawn ones. Delta 1117 to Salt Lake City and SkyWest 3743, the first flight to Los Angeles, both rank among the most punctual flight numbers from San Diego.
Thursday and Friday are the weak days
San Diego's best days were Tuesday at 82.9% and Saturday at 83.0%. Its worst was Thursday at 71.1%, with Thursday close behind at 71.1%. The 11.9-point spread between best and worst day is wider than the national 8.1. Southwest's weekday pattern at SAN carries most of it: the heaviest leisure and commuter days load the aircraft, lengthen the turns and push the afternoon trough deeper.
San Diego's fog is not the problem. The trouble is at the other end.
San Diego (SAN)76.3% overall
SAN → SFO59.5% overall
SAN → LAS73.7% overall
SAN → DEN78.4% overall
All panels share one scale. Source: US DOT Bureau of Transportation Statistics, September 2025 to August 2026.
San Diego's best months were January 2026 at 83.1% and February 2026 at 84.0%. Its worst were June 2026 at 71.1% and July 2026 at 68.1%, the latter below the national 71.7% for that month.
The obvious suspect is the marine layer, the low cloud that sits on the Southern California coast in May and June. The data points somewhere else. San Diego's dawn departures, the ones that meet the thickest cloud, were still the airport's most punctual window in June and July. The collapse is concentrated on one route: San Diego to San Francisco, the busiest route from the airport, ran 38.8% on time in June 2026 and 39.0% in July, and 59.5% across the year, rank 2,968 of 2,978 routes. Of its delay minutes, 53% were coded to the air traffic system.
It is not only San Diego's flight. From April to July 2026, flights into San Francisco fell to roughly 35 to 50% on time on several routes. When I first saw it I took it for a bug in my aggregation; checked against the raw month files, it is in the data. The data does not say why.
San Francisco's two parallel arrival runways sit too close together to use side by side in low cloud, and a pattern of ground holds for SFO-bound flights is consistent with that constraint, though the cause codes cannot confirm it. Flights bound there wait on the ground in San Diego. The Bay Area guide explains the mechanism; the California intrastate guide shows every California route it touches.
The routes
US average 77.3%
50.0%90.0%
The line under each bar is the route's cancellation rate. Dashed line: US average. Source: US DOT Bureau of Transportation Statistics, September 2025 to August 2026.
The strongest big routes run to hubs with room to land: San Diego to Salt Lake City at 83.0%, to Atlanta at 85.7%, and the short San Diego to Los Angeles hop at 87.4%, rank 151 nationally. The desert shuttles are weaker than their short distance suggests: San Diego to Las Vegas ran 73.7% and to Phoenix 73.5%, and Southwest's San Diego to Dallas Love Field managed 66.8%.
Within the San Francisco route, the airline matters. United on San Diego to San Francisco ran well ahead of Southwest on the same route, consistent with United, as the hub carrier, holding most of the arrival slots at SFO and being able to reshuffle them among its own flights when a ground delay programme is in force. The alternatives inside the Bay Area help more: San Diego to San Jose ran 74.5% and to Oakland 72.9%.
Hawaii is its own case. San Diego to Honolulu ran 72.0%, with a wide split between its three carriers; the Hawaii guide compares every mainland gateway.
What I would book from San Diego
Fly before 11am, or after 5pm on a long flight. The dawn wave is the best of the day; the 2pm to 5pm window is the one to avoid, especially on short Southwest hops.
For the Bay Area in summer, book San Jose or Oakland. Unless you need SFO itself, the other two Bay Area airports avoid San Francisco's arrival programmes. If it has to be SFO, take the earliest United flight. After a June 2026 at 38.8%, I would not put anything time-critical on a summer afternoon flight to SFO.
Travel on Tuesday, Wednesday or Saturday. Thursday and Friday afternoons combine the weakest days with the weakest window.
Expect short delays, not cancellations. San Diego's cancellation rate and hour-late share are both below the national figures, so a 45-minute buffer covers most of what goes wrong here. Connections elsewhere are a different question; check them in the connection risk tool.
Compare the fields: San Diego (SAN) · Los Angeles (LAX) · San Francisco (SFO) · San Jose (SJC) · Ontario (ONT) · Compare any US route