Guide
Charlotte airport delays: how reliable is flying out of CLT?
Charlotte Douglas departures ran 76.1% on time over the year. American's connecting hub is excellent at dawn, fragile after 2pm, and at its worst in July.

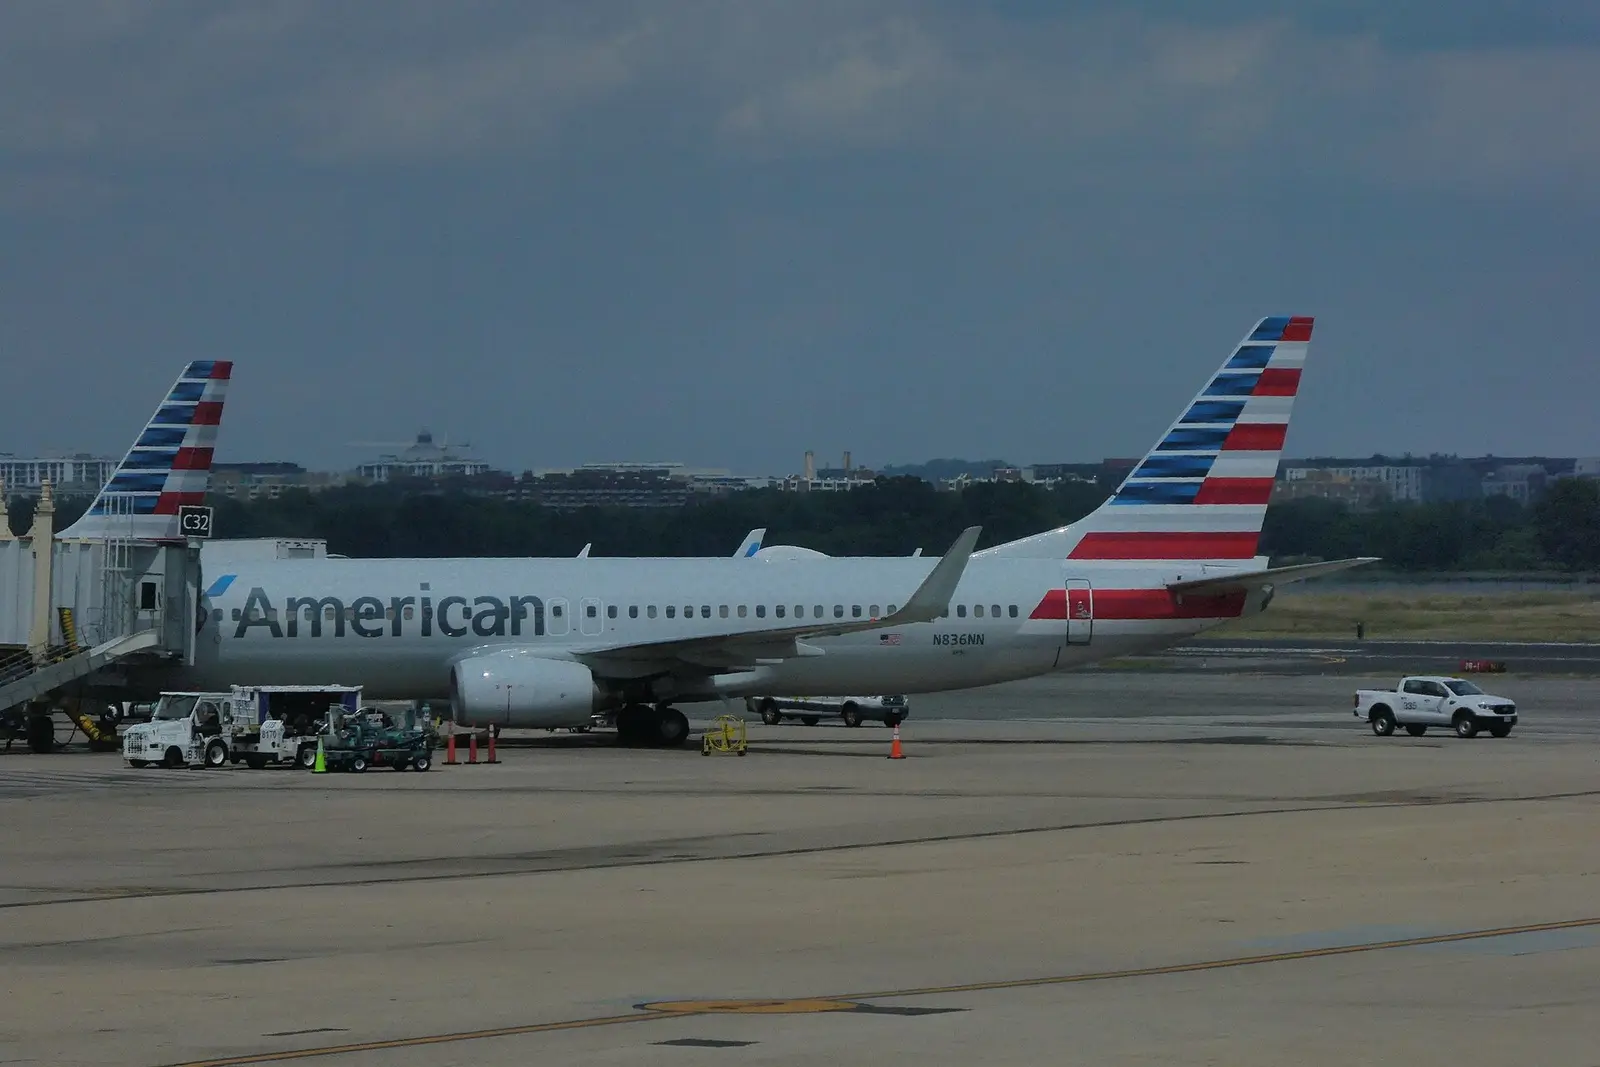
More than eight in ten departures from Charlotte are flown by American Airlines or its regional subsidiary PSA, and most of their passengers are not from Charlotte.
They are changing planes. That makes Charlotte Douglas the purest connecting hub in this set of airport guides, and its record is the record of a timetable built around waves of aircraft arriving and leaving together.
Over September 2025 to August 2026, Charlotte's 181,003 departures ran 76.1% on time against 77.3% nationally, ranking 45 of 60 airports with a page. It cancelled 2.06% of departures and 9.1% arrived an hour or more late, both a touch worse than the country. As always on this site, these are flights leaving Charlotte, scored at their destination.
Two carriers, one timetable
CLT average 76.1%
60.0%90.0%
Departures from CLT by carriers with at least 1,000 scheduled flights. The line is the airport average. Source: US DOT Bureau of Transportation Statistics, September 2025 to August 2026.
American at Charlotte and PSA at Charlotte define the airport average because they are most of it. Both sit near the line. American's Charlotte operation runs slightly ahead of American's network as a whole, which ran 74.7% on time.
The carriers at the top of the chart are the small guests: Delta, Envoy and Republic, each flying a few thousand departures, mostly to their own hubs. Their aircraft arrive from somewhere else, turn once and leave, without being tied into Charlotte's banks. On the Charlotte to Atlanta route, Delta's flights ran far ahead of PSA's, and on Charlotte to LaGuardia Republic beat American by a wide margin. Frontier sits at the bottom, as it does at Atlanta and Philadelphia.
How a banked hub fails
Departures from CLT grouped by scheduled local departure time. Source: US DOT Bureau of Transportation Statistics, September 2025 to August 2026.
The first bank of the day is one of the strongest in the country: 89.6% on time before 8am. By the 2pm to 5pm window, Charlotte is down to 72.4%, and it stays there: 69.0% between 5pm and 8pm and 68.9% after 8pm. The fall is 20.6 points against 21.3 nationally, and unlike the national curve, the late-night departures do not recover. That flat, low tail after 2pm is the figure I would weigh most before routing through Charlotte.
The reason is the bank structure. Charlotte schedules its flying in waves: dozens of aircraft land within a short window, passengers change planes, and the same aircraft leave together. Each bank depends on the one before it. A thunderstorm that stops arrivals for 40 minutes at 3pm delays not only the 3pm bank but the aircraft and crews for the 5pm and 8pm banks. Late-arriving aircraft account for 47% of Charlotte's delay minutes, against 40% nationally, which is that propagation in the DOT's own cause codes.
Charlotte also runs a heavy late-evening schedule, with more departures after 8pm than in any other window of the day. Those flights carry every accumulated delay and the weakest recovery options. American's 8:33pm to Newark, AA 2794, and its 6:04pm to LaGuardia, AA 1060, were among the least punctual departures from the airport. Delta's 6am to Detroit, DL 1405, was among the best.
Summer is the Charlotte problem
Each month is one month of one year: August to December 2025, January to July 2026. Source: US DOT Bureau of Transportation Statistics, September 2025 to August 2026.
The worst month was July at 63.8%, the best September at 84.0%, a gap of 20.2 points. July at Charlotte is thunderstorm season in the Carolinas, and a banked hub amplifies it: one afternoon cell over the airport disrupts every bank that follows. June at Charlotte ran 72.1%, and September at Charlotte, with the storms gone, ran 84.0%.
January at Charlotte looks healthy at 80.7% on time. It was not. The month's cancellation rate was the highest of any month at any of the airports in this series of guides, roughly one departure in ten, consistent with a winter storm that brought snow and ice to the Carolinas. The on-time rate is computed only over flights that operated, so the storm is invisible in it.
What surprised me in the national data was the geography. January 2026 had the highest national cancellation rate of the year, and it was concentrated at Charlotte, Dallas-Fort Worth and Washington National rather than in the snow belt. In the Southeast winter weather is rare, and airlines there likely cancel early rather than attempt a de-icing operation the region is not built for.
Weekdays
The best weekday was Wednesday at 83.5%, the worst Sunday at 69.1%. That 14.4-point spread is one of the widest at any large hub. Monday (74.0%) was the second-weakest day. A banked hub carries peak volume on the busiest travel days, and there is no spare capacity in a bank to absorb it.
Where the delay minutes come from
Share of all delay minutes. Darker is a bigger share. Air traffic is the National Airspace System category; weather is extreme weather only.
Shares of all delay minutes reported by the airlines. Source: US DOT Bureau of Transportation Statistics, September 2025 to August 2026.
Charlotte's air traffic share is low: 15% of delay minutes, against 21% nationally. The airspace is not the problem. The operation is. Dallas-Fort Worth, American's biggest hub, shows the same shape, low air traffic share and heavy late aircraft, while Atlanta codes far more of its delay to the airline. The difference is partly how each airline assigns causes, but the lesson for a passenger holds: at Charlotte, the risk sits in the chain of aircraft, and the chain gets longer through the day.
Best and worst routes
The weakest busy route from Charlotte is Charlotte to Washington National, at 67.5%, into a slot-controlled airport with no slack. The busiest, Charlotte to Orlando, ran 71.6%, and Charlotte to O'Hare 72.4%.
The best busy routes go north and west to Delta hubs: Charlotte to Minneapolis at 81.5%, Charlotte to Detroit at 81.7% and Charlotte to Atlanta at 81.3%.
One route shows how much direction matters, and it is why the pipeline keeps the two directions of every route as separate records. Charlotte to San Francisco ran 65.6% on time, while San Francisco to Charlotte ran 83.6%: the westbound flights leave mostly in Charlotte's weak evening window and land into San Francisco's arrival programmes, while the eastbound schedule is made of morning departures and overnight flights that avoid both. The opposite-direction guide covers why busy pairs split this way.
Connecting at Charlotte
Inbound flights from the West hold up well: Las Vegas to Charlotte ran 87.0% and Phoenix to Charlotte 87.6%. The risky inbound legs come from the other big congested hubs, such as O'Hare to Charlotte at 73.7%. Charlotte's place in the missed-connection table is closer to the safe end than its departure record suggests, because the table measures flights arriving at the hub rather than leaving it. The connection risk calculator runs the same numbers for your own inbound route. The connecting hub guide compares Charlotte with Atlanta and the other options for East Coast trips.
How I would route through Charlotte
Connect in the morning banks. Before 11am, Charlotte is one of the better hubs in the country. After 2pm it is an average one with a long chain behind every flight.
In June and July, add 30 minutes. A 60-minute connection that works in October is a coin flip on a stormy July afternoon.
Do not book the last bank. If the 8pm connection fails, there is often nothing left until morning. At 68.9% on time for late-night departures, I would take a morning connection and a longer day over it.
Avoid Sundays and Mondays when the dates are flexible; the midweek days are worth the 14.4 points.
Explore Charlotte: Charlotte Douglas (CLT) · American at CLT · CLT in July · Connection risk calculator · Atlanta airport guide