Guide
Baltimore BWI delays: how reliable is flying out of BWI?
BWI departures ran 77.1% on time, and only 6.9% arrived an hour or more late. Southwest's East Coast base is punctual until mid-afternoon, then fades fast.

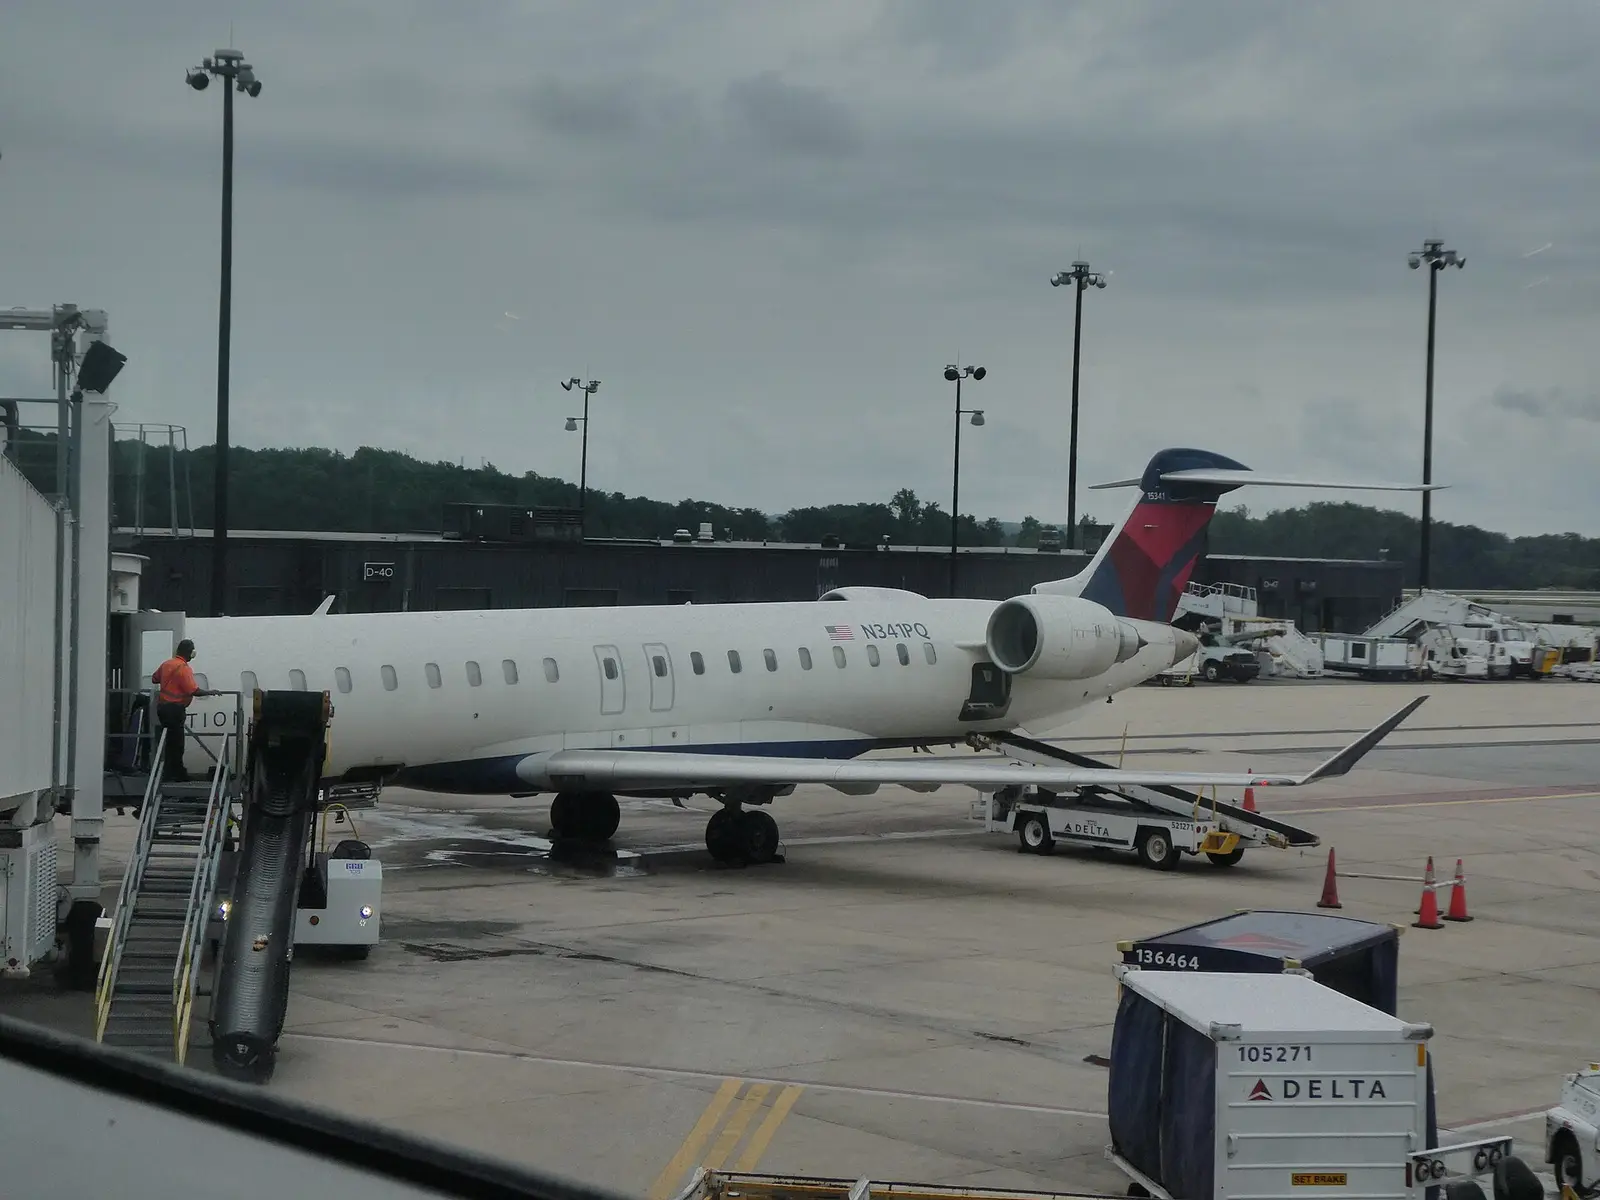
Three airports serve Washington, and the DC airports guide sets them side by side. This guide stays with the one Southwest built: Baltimore/Washington International. Over September 2025 to August 2026 its departures ran 77.1% on time, between Dulles at 81.0% and Washington National at 72.2%, and it ranked 38 of 60 airports with a page.
The headline undersells BWI in one respect. Only 6.9% of its departures arrived an hour or more late, against 8.3% nationally and 11.4% at National, and a late BWI flight averaged 61 minutes behind, against 73 nationally. It cancelled 1.95% of departures, about half National's rate of 3.99%.
BWI is late fairly often, and rarely late for long.
As on every airport page, these figures cover flights departing BWI. When I compare airports I look at the very-late share before the on-time rate, because an hour's delay is what breaks a connection or a dinner, and on that measure BWI does better than its rank suggests.
Southwest's airport
BWI average 77.1%
60.0%90.0%
Departures from BWI by carriers with at least 1,000 scheduled flights. The line is the airport average. Source: US DOT Bureau of Transportation Statistics, September 2025 to August 2026.
About three of every four departures from BWI are Southwest flights, which makes Southwest at BWI the airport's record in all but name. It is one of Southwest's largest bases and its main one on the East Coast. Southwest brings its network profile with it: it cancelled 0.92% of its flights nationally and its late flights averaged 53 minutes, both among the lowest of any airline. That is why BWI's long-delay and cancellation figures look better than its on-time rate.
The other carriers are small and mostly fly to their own hubs. Delta sits well above the average, with United and American above it too. Frontier, as at several eastern airports, trails the chart. On the BWI to Atlanta route, the busiest from the airport, Delta's flights ran well ahead of Southwest's, which in turn beat Frontier's.
A steep afternoon
Departures from BWI grouped by scheduled local departure time. Source: US DOT Bureau of Transportation Statistics, September 2025 to August 2026.
BWI's first wave is among the strongest in the East: 89.8% on time before 8am, and still 87.1% between 8am and 11am. Then the curve drops: 80.0% from 11am, 72.9% from 2pm, 66.3% from 5pm and 64.9% after 8pm. The fall from dawn to evening is 23.5 points, against 21.3 nationally.
That is the Southwest shape. Aircraft fly several point-to-point legs a day with short turns, and a delay picked up in Orlando at noon rides the same airframe back through Baltimore and on to Boston in the evening. By late afternoon, many BWI departures are likely aircraft that have already flown three or four legs. Late-arriving aircraft account for 40% of BWI's delay minutes. The evening fade guide sets Southwest's curve against every other airline's.
BWI also does not recover after 8pm, as the national curve does: its late-night window is its worst. The last Southwest departures of the night carry the whole day's delay, and there is no overnight gap to absorb it until they land.
Delta's early flights to its hubs were BWI's most punctual regular departures: DL 2950, the 6am to Atlanta, and DL 2601, the 6am to Detroit. United's 5:20pm to O'Hare, UA 590, was among the least punctual.
No Southwest flight number from BWI made either list, and that is a limit of the data rather than of the airline. Southwest reuses its flight numbers across different city pairs on different days, so when I built the flight pages only six Southwest numbers flew one route often enough to earn one, none of them from Baltimore.
Summer and holidays
Each month is one month of one year: August to December 2025, January to July 2026. Source: US DOT Bureau of Transportation Statistics, September 2025 to August 2026.
The worst month was August at 68.9%, with December at BWI at 70.4% and June at 70.9% close behind. Mid-Atlantic summer thunderstorms build in the afternoon, which is exactly when BWI's curve is already falling; December is a holiday-volume month on a full schedule. The best month was September at 85.5%.
January at BWI and February posted strong on-time rates, 82.9% and 83.1%, but January's cancellation rate was roughly three times the airport's annual figure, consistent with a winter storm that grounded flights rather than delaying them. On-time rates count only the flights that operated. Over the 2026 July 4th week, which nationally ran 0.9 points better than the weeks either side, BWI's cancellation rate was one of the highest of any airport; the holiday page has the airport table.
Weekdays
The best weekday was Tuesday at 81.7%, the worst Sunday at 71.3%. Monday, Thursday and Friday sat together at around 76.4%, and Wednesday (81.5%) was nearly as good as Tuesday. A spread of 10.4 points makes the weekday a real lever here.
data/generated/airports/BWI.json, trimmed to the headline fields
{
 "flights": 94023,
 "completed": 91987,
 "onTimePct": 77.1,
 "veryLatePct": 6.9,
 "avgDelayMin": 61.1,
 "medianArrDelay": -5,
 "cancelPct": 1.95,
 "divertPct": 0.21,
 "causes": {
  "carrier": 0.3347,
  "weather": 0.048,
  "nas": 0.2147,
  "security": 0.0052,
  "lateAircraft": 0.3974
 },
 "byHourBlock": [89.8, 87.1, 80, 72.9, 66.3, 64.9 ],
 "byMonth": [82.9, 83.1, 74.6, 79.9, 76.7, 70.9, 69.5, 68.9, 85.5, 81.4, 82.9, 70.4 ],
 "byDow": [76.2, 81.7, 81.5, 76.4, 76.1, 76.9, 71.3 ]
}
Percentages are shares of scheduled or completed flights as defined on the methodology page; byHourBlock runs 5am to overnight, byMonth January to December, byDow Monday to Sunday. Source: US DOT Bureau of Transportation Statistics, September 2025 to August 2026.
This is the record the pipeline writes for BWI each month; every figure in this guide is recomputed from it, which is why none of them is typed in by hand.
Where the delay minutes come from
Share of all delay minutes. Darker is a bigger share. Air traffic is the National Airspace System category; weather is extreme weather only.
Shares of all delay minutes reported by the airlines. Source: US DOT Bureau of Transportation Statistics, September 2025 to August 2026.
BWI's cause profile is almost exactly the national one: the air traffic system at 21% of delay minutes, late aircraft at 40%, the airline at 33%. Washington National, which runs a slot-controlled schedule close to its capacity all day, carries a heavier late-aircraft share, and Dulles a higher air traffic share. Nashville, Southwest's other big eastern base, has an even heavier late-aircraft share.
Best and worst routes
The best busy routes from BWI are short Southwest hops into New England and upstate New York. BWI to Manchester ran 84.2%, BWI to Hartford 81.2% and BWI to Albany 80.4%. BWI to Detroit, at 80.8%, and BWI to Charlotte, at 80.8%, are the best of the hub routes.
The weakest go to congested or storm-prone destinations: BWI to Los Angeles at 72.8%, BWI to Boston at 74.1% and the Florida routes, led by BWI to Orlando at 75.5%. On Los Angeles, United ran far ahead of Southwest. On Boston, Republic's flights beat Southwest's, largely because Southwest's evening departures on the route collapsed.
Connecting at BWI
Southwest connections through BWI are common for trips between New England and the Southeast. The good news is the inbound side: Albany to BWI ran 87.9% and Manchester to BWI 88.4%. The weak inbound legs come from South Florida and O'Hare: Fort Lauderdale to BWI ran 71.0%. Use the connection risk calculator with your actual inbound flight.
Timing matters more than the layover length here. A Southwest connection is two separate rotations that happen to meet at BWI, with no bank holding the second flight for the first. A connection built from two morning flights inherits BWI's strong first waves at both ends; one built from two evening flights inherits the steepest part of the curve twice. The connection buffer guide sets out how much time each case needs.
What I would book out of BWI
Choose BWI over National for anything after the first wave. National's record after 8am and its cancellation rate are both worse, and BWI's long-delay figure is one of the lower ones in the East.
Book before 11am. BWI's first two windows are both strong. The drop starts at lunchtime, not at dusk.
Avoid the last Southwest departures of the night. At BWI the late-night window is the worst of the day. At 64.9% on time I would not put anything that cannot move behind the final departure.
On Los Angeles and Boston, compare carriers. The carrier gap on both routes is wider than the gap between BWI and its DC neighbours.
Explore BWI: Baltimore/Washington (BWI) · Southwest at BWI · BWI in July · Washington DC airports · Nashville airport guide