Guide
Dallas and Houston airports, plus Austin and San Antonio
DFW ran 72.8% on time, Love Field 72.6%, Houston Intercontinental 79.1% and Hobby 76.5%. Two Texas cities, two airports each, and a choice that depends on the hour.

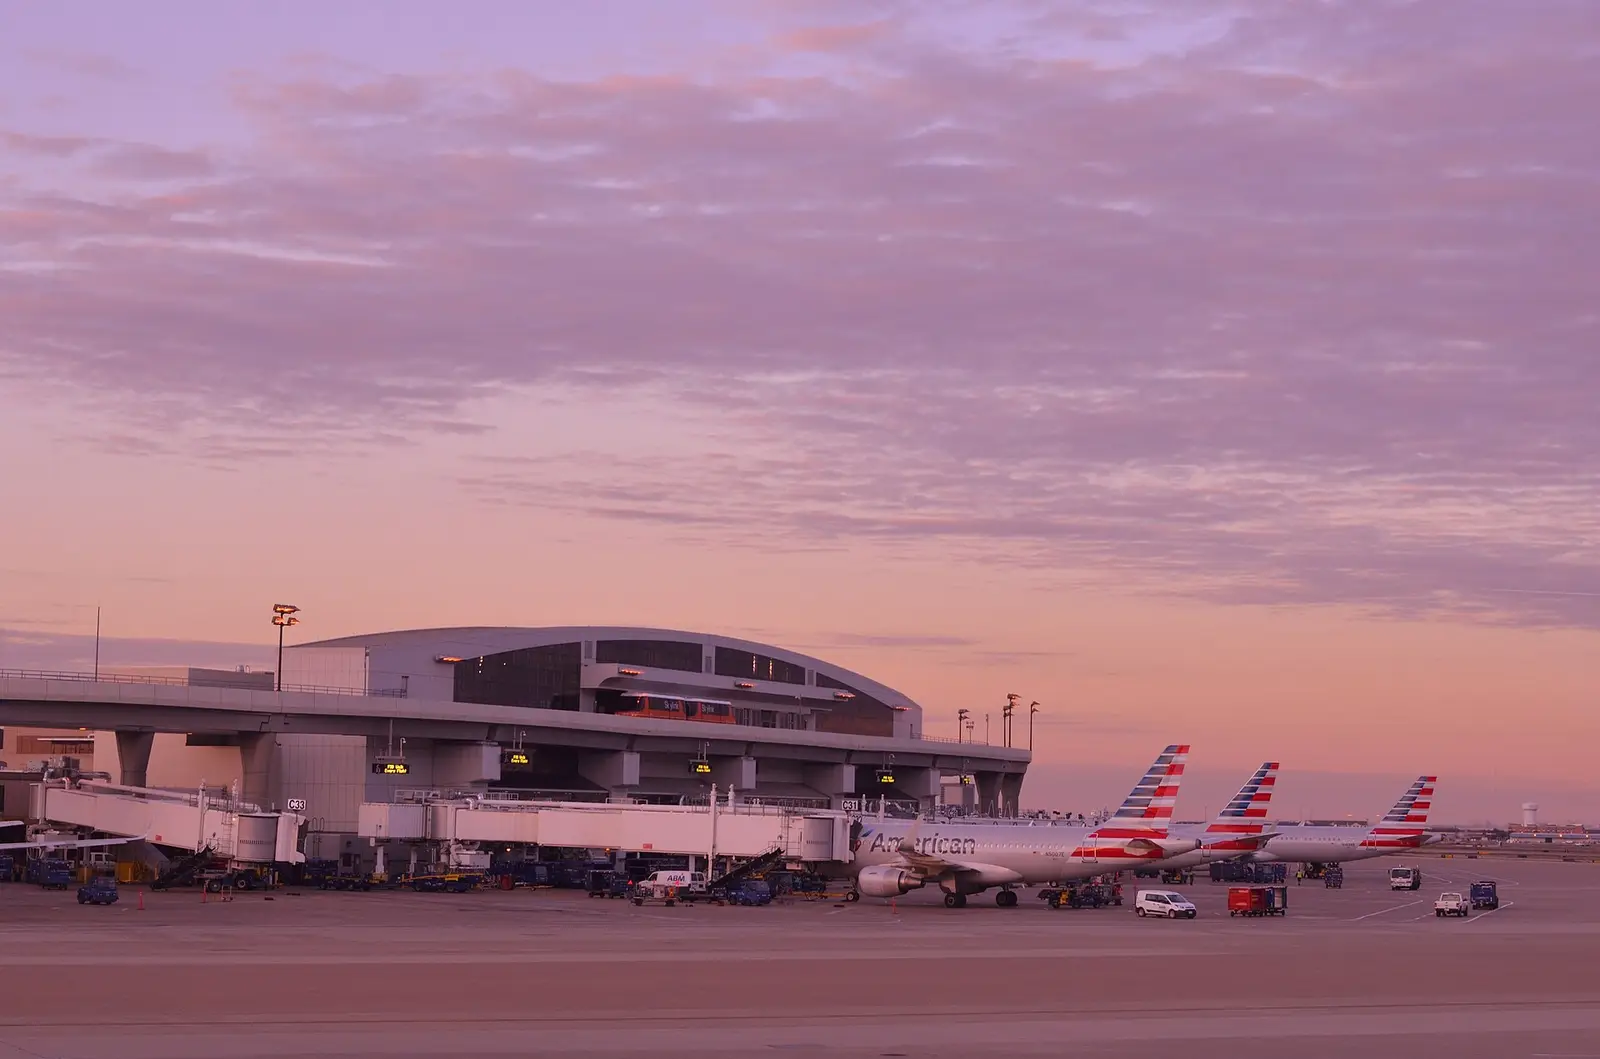
Dallas-Fort Worth and Dallas Love Field sit fifteen miles apart and ranked 55 and 56 of 60 airports on this site for on-time departures over September 2025 to August 2026. Houston's two airports did better: Intercontinental ranked 25, Hobby 43. San Antonio, with no hub and a modest schedule, ranked 6, ahead of all four.
The headline numbers are only the start. Each of these airports fails in its own way, at its own time of day, and the right choice between them changes between a 7am and a 7pm departure.
As everywhere on this site, an airport's figures cover the flights departing it, scored on arrival at their destination.
US average 77.3%
65.0%85.0%
Departures from each airport. The line under each bar is its cancellation rate. Source: US DOT Bureau of Transportation Statistics, September 2025 to August 2026.
Dallas: a hub and a Southwest fortress
DFW is American Airlines' largest hub and one of the busiest airports in the world, with 312,771 scheduled departures in the period. Love Field is almost entirely Southwest: federal limits on the airport cap it at 20 gates, and Southwest holds nearly all of them.
On the headline figure they are close: 72.8% on time at DFW, 72.6% at Love Field. Below the headline, they differ a lot.
DFW cancels more. It scrubbed 2.61% of scheduled departures against 1.37% at Love Field, and 10.4% of its departures arrived an hour or more late, against 8.0%. When a DFW flight is late it averages 73 minutes behind; at Love Field, 55. Love Field's delays are about as frequent and much shorter, the classic Southwest profile of short turns and many small knock-on delays.
Neither airport's problem is the air traffic system. It accounts for only 14% of DFW's delay minutes and 16% of Love Field's. Late-arriving aircraft dominate both, at 47% and 50%. DFW also carries one of the higher shares of extreme-weather delay in the country, 8% against 6% nationally, consistent with the hail, severe thunderstorms and occasional ice that North Texas produces.
The hub carrier is the other part of the DFW story. American mainline departures ran well below the airport average, while American's own regional subsidiary Envoy, flying from the same terminals, ran well above it. The hub guide covers that gap.
The hour decides Dallas
Dallas-Fort Worth (DFW)72.8% overall
Dallas (DAL)72.6% overall
Houston (IAH)79.1% overall
Houston (HOU)76.5% overall
Austin (AUS)76.5% overall
San Antonio (SAT)82.0% overall
All panels share one scale. Windows run 5am, 8am, 11am, 2pm, 5pm and 8pm to 5am. Source: US DOT Bureau of Transportation Statistics, September 2025 to August 2026.
Love Field's morning-to-evening curve is among the steepest of any airport on this site. Departures between 5am and 8am ran 91.5% on time, between 5pm and 8pm 59.9%, and after 8pm 53.5%. That 31.6-point gap compares with 21.3 points nationally. A Southwest aircraft leaving Love Field at dawn has spent the night there. By evening it has flown several legs through Texas and beyond, and every delay it picked up is still on board.
DFW's curve is flatter, from 85.2% at dawn to 65.1% in the evening, mostly because its mornings are weaker: its first wave is one of the least punctual of the 60 airports. The cause codes do not isolate why.
The practical result is a crossover. In the morning, Love Field is the clearly better bet. In the evening the advantage disappears, and DFW's much deeper schedule gives it more options if something is cancelled.
Houston: the hub beats the secondary airport
Houston runs against the common assumption that the smaller secondary airport is the easier one. George Bush Intercontinental, United's hub, ran 79.1% on time. Hobby, where Southwest flies almost everything, ran 76.5%.
The difference in character mirrors Dallas. Hobby's late flights were shorter: 53 minutes on average against 75 at Intercontinental, and only 6.3% of Hobby departures arrived an hour or more late, against 7.8%. Hobby also cancelled less, 0.86% against 1.10%. Intercontinental is late less often; Hobby is late by less.
Intercontinental carries the higher air traffic share of the two, 24% of delay minutes against 17% at Hobby, consistent with a hub whose departures feed United's other hubs at Newark, Chicago, Denver and San Francisco, where flow programmes are common. Hobby's curve through the day is steeper, from 92.6% at dawn to 66.3% in the evening, against 89.2% and 71.5% at Intercontinental. Hobby at 6am is one of the most punctual departures in Texas. Hobby at 6pm is not.
The Southwest shuttle
Between Love Field and Hobby, Southwest flew 4,044 flights over the period from Dallas to Houston and 4,039 back. The two directions ran differently: Love Field to Hobby 74.8% on time, Hobby to Love Field 81.6%. The Love Field departures inherit Love Field's evening problem. From Love Field the first flight of the day ran 93.0% on time and evening flights 62.4%. On a 240-mile hop, the departure time matters more than the airline or the aircraft.
The shuttle also explains an oddity of the flight pages. Southwest reuses its flight numbers across different city pairs on different days, so when I built those pages only six Southwest numbers flew one route often enough to earn one, and three of the six are this shuttle: WN 1628 from Love Field, WN 46 and WN 1636 from Hobby.
Summer is the Texas season to fear
Dallas-Fort Worth (DFW)72.8% overall
Dallas (DAL)72.6% overall
Houston (IAH)79.1% overall
Houston (HOU)76.5% overall
Austin (AUS)76.5% overall
San Antonio (SAT)82.0% overall
All panels share one scale. Source: US DOT Bureau of Transportation Statistics, September 2025 to August 2026.
The worst month in this period was June at DFW (63.6%), June at Love Field (56.5%), June at Intercontinental and June at Hobby. Early summer brings the Gulf moisture that fuels afternoon and evening thunderstorms across the state, landing on exactly the departure windows that are already weakest. The best months were in winter: January at Love Field at 82.8%, January at Hobby at 88.0%. Love Field's gap between its best and worst month was 26.3 points.
Winter is not risk-free. An ice storm in North Texas shuts DFW and Love Field together, usually for a day or two, and that shows up as a burst of cancellations rather than a bad on-time month. This year had one. January 2026 carried the highest national cancellation rate of the twelve months, and when I looked at where the cancellations sat, Dallas-Fort Worth was one of the three airports that took most of them, alongside Charlotte and Washington National, rather than anywhere in the snow belt.
A good January on-time figure at DFW does not mean a good January.
Austin and San Antonio
Austin-Bergstrom International ran 76.5% on time, in the middle of the Texas pack. Southwest is its largest carrier, and its curve through the day looks like the Southwest airports: 90.7% at dawn, 65.9% in the evening. Its worst month was June at 69.1%.
San Antonio International is the quiet success, at 82.0%. Its schedule is spread across Southwest, American, Delta and United, and no carrier runs connecting banks there, which is consistent with an airfield that rarely has to absorb a surge. Its weakest window is late at night: departures after 8pm ran 64.0%.
Share of all delay minutes. Darker is a bigger share. Air traffic is the National Airspace System category; weather is extreme weather only.
Rows ranked by the air traffic share. Source: US DOT Bureau of Transportation Statistics, September 2025 to August 2026.
My call on Dallas and Houston
Dallas, morning: Love Field on Southwest, if it flies your route. At 91.5% on time before 8am, it is one of the best departures in the state.
Dallas, evening or connecting: DFW. Neither airport runs well after 5pm, but DFW has the deeper schedule to rebook you. At 53.5% on time after 8pm, I would not book a late Love Field departure with anything tight at the other end. If you connect at DFW, connect early in the day and leave extra buffer in summer.
Houston, a short trip on Southwest: Hobby, early. Its late flights are shorter and it cancels less.
Houston, any time after lunch: Intercontinental. Its curve holds up better through the afternoon, though its late flights run longer when they happen.
Between Dallas and Houston: take the morning shuttle in either direction and avoid the last Love Field departures of the evening.
Flying in summer from any of the six: book before noon. Early-summer storms land on the evening departures at every one of these airports.
Compare the fields: Dallas-Fort Worth (DFW) · Dallas Love Field (DAL) · Houston Intercontinental (IAH) · Houston Hobby (HOU) · Austin (AUS) · San Antonio (SAT)