Guide
Los Angeles has more than one airport, and LAX is rarely the best of them
Los Angeles International runs 80.5% on time. John Wayne Airport manages 81.7%. In a region defined by driving, the second airport is often the better trade.
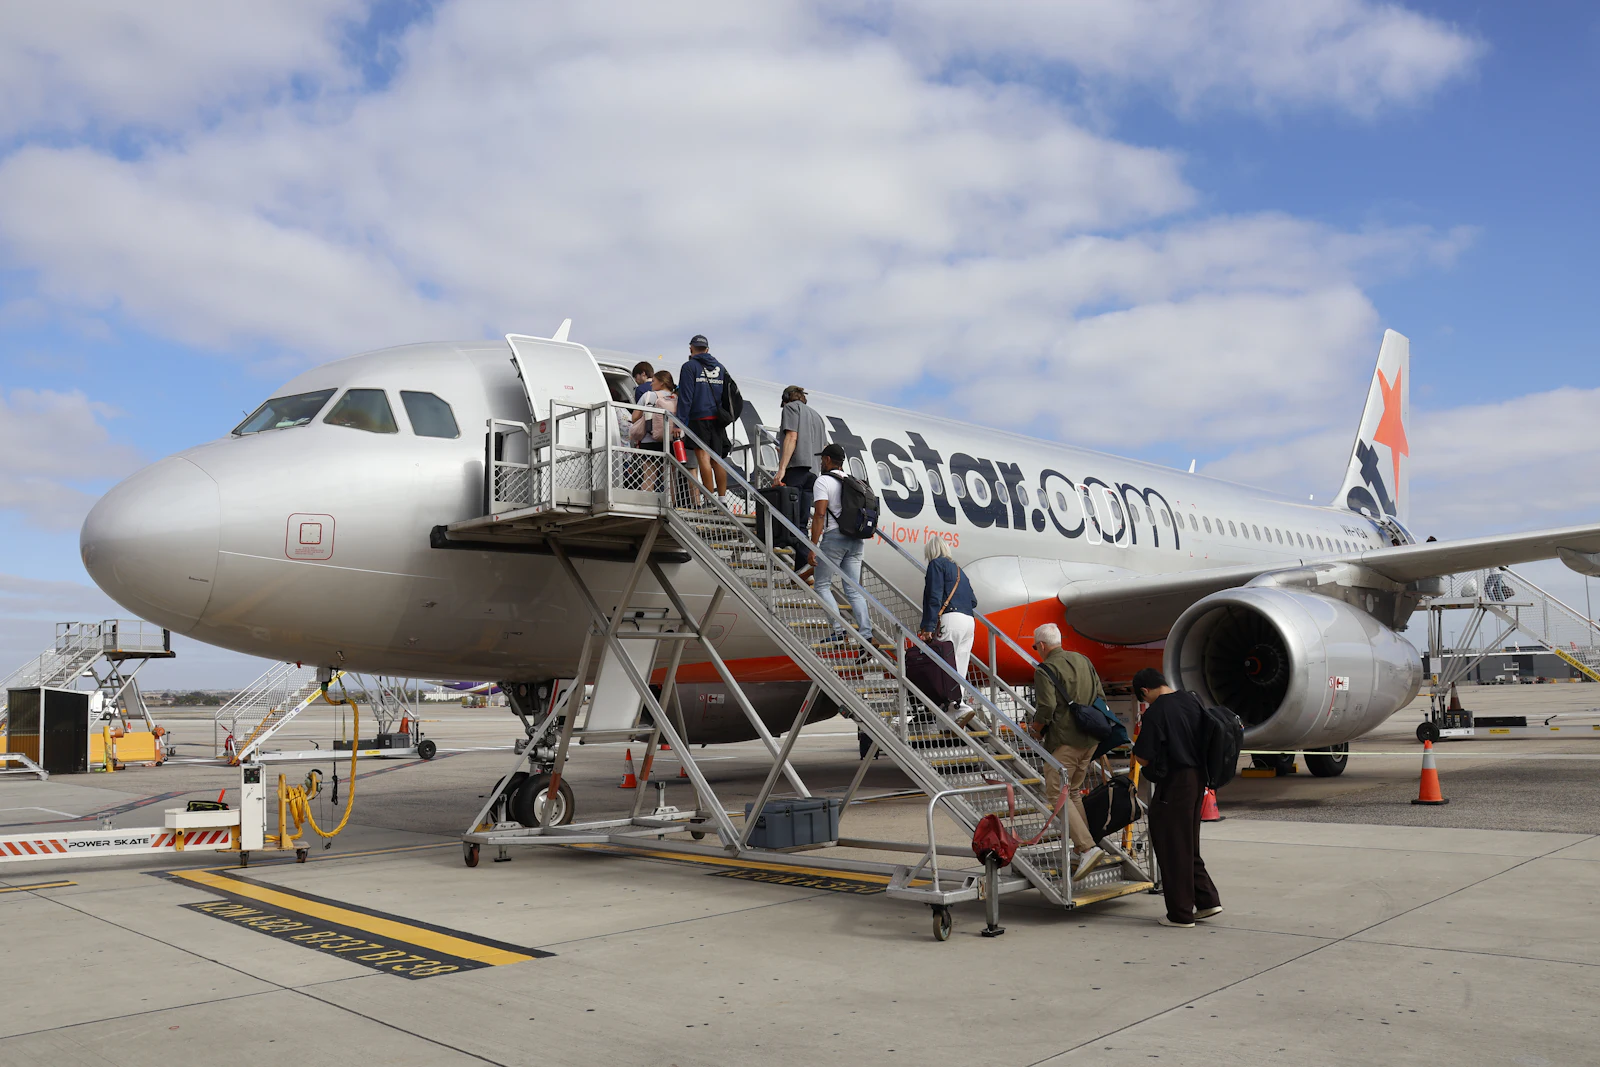
Southern California is the one US market where the drive to the airport is genuinely negotiable, because everything is a drive. That makes the airport choice more open than it is anywhere else, and the operational records differ enough to matter.
Over June 2025 to May 2026: Los Angeles International arrived on time 80.5% of the time, while John Wayne Airport managed 81.7%.
Ontario, Burbank and Long Beach also serve the basin. They are small enough that their figures move around year to year, so treat any number you see for them with more caution than the two above.
Why the biggest field is not the best performer
LAX handles enormous traffic across four parallel runways in a layout that requires aircraft to cross active runways to reach the terminals. Taxi times are long, ground movement is complex, and the schedule saturates for most of the operating day.
None of that is a criticism of anyone's management. It is the arithmetic of running a very large operation on a constrained footprint, and it is why 21% of national delay minutes land in the airspace-and-volume category rather than the carrier one.
The smaller basin airports have spare capacity, short taxi times, and no arrival bank to queue behind. They also have a fraction of the destinations.
The real trade in this market
Southern California inverts the usual calculation, because the ground journey is long from everywhere. An hour to LAX from Orange County is not obviously better than forty minutes to John Wayne, and the flight from John Wayne is more likely to arrive when promised.
Set against that: LAX flies almost everywhere non-stop, and the smaller fields do not. If choosing the closer airport means inserting a connection, take LAX. A connection costs more reliability than the airport difference recovers.
Cancellations, for the same pair: 0.94% at LAX and 1.10% at John Wayne.
Weather is not the variable here
Southern California produces few weather cancellations, which makes the basin unusual. What delays flights here is volume, ground movement, and inherited delay from aircraft arriving late off earlier legs.
That has a useful consequence: the time-of-day effect is unusually clean. Without weather noise, the daily decay curve is close to the textbook shape, and a morning departure is worth more here than at a field where a thunderstorm can ruin any hour equally.
Choosing
Take the non-stop. If two fields both offer one and the drive is comparable, take the smaller field. If the drive is not comparable, measure it honestly at the hour you will travel, on a weekday, and let that decide.
And whichever you pick, take the early departure. In a market where inherited delay is the dominant cause, that is the lever that works.
Frequency, and what a cancellation costs
The basin's smaller fields win on delay figures and lose on recovery. That trade is worth making explicit.
A cancellation at LAX finds you another seat within hours: the schedule is deep, several carriers serve most destinations, and spare aircraft are on the property. At a field with three daily departures on your route, the same event can mean tomorrow.
So the ranking is one input, not a rule. On a route flown many times daily from the smaller field, take the smaller field. On a thin route, the big airport's depth is worth more than its worse average.
Stage length is doing some of the work
LAX carries the longest average stage length of the basin fields by a wide margin, and long flights carry more scheduled block time in absolute minutes. A transcontinental departure has hours in which to recover a late pushback; a flight to Phoenix has minutes.
That cuts against the ranking above rather than for it: LAX posts its figure despite flying the routes with the most built-in padding. Comparing the same destination from two fields, on their own pages, removes that distortion and is the comparison worth making.
The daily curve is unusually clean here
Nationally the 5am–8am window runs 89.3% on time against 67.7% for 5pm–8pm. Southern California produces few weather cancellations, so the basin's curve is close to the textbook shape without the noise a thunderstorm market adds.
That has a practical consequence. In a market where inherited delay from earlier legs is the dominant cause rather than weather, the morning departure is worth more than it is almost anywhere else, and the advice generalises across all the basin fields rather than needing to be checked per airport.
Check the return leg separately
Routes on this site are directional, and the two directions of the same city pair frequently differ by several points. That is not a quirk of the data; they are separate operations, flown by different aircraft, out of different departure banks, into airports with different congestion at the hour of arrival.
For the basin this matters more than usual, because an eastbound departure leaves into a full national airspace system while a westbound arrival lands into a mostly empty one. Look up both legs before booking, not just the outbound. The page for each direction names the other one's figure so the comparison takes one click.
Fares differ across the basin too, and not always in the direction you expect: the smaller fields are sometimes cheaper because carriers are buying market share there, sometimes dearer because a single airline holds the route. That is worth a search rather than an assumption.
Compare the fields: Los Angeles (LAX) · John Wayne (SNA)